The manager dashboard
Guide utilisateur
User guide
1 Enter the community
Home page
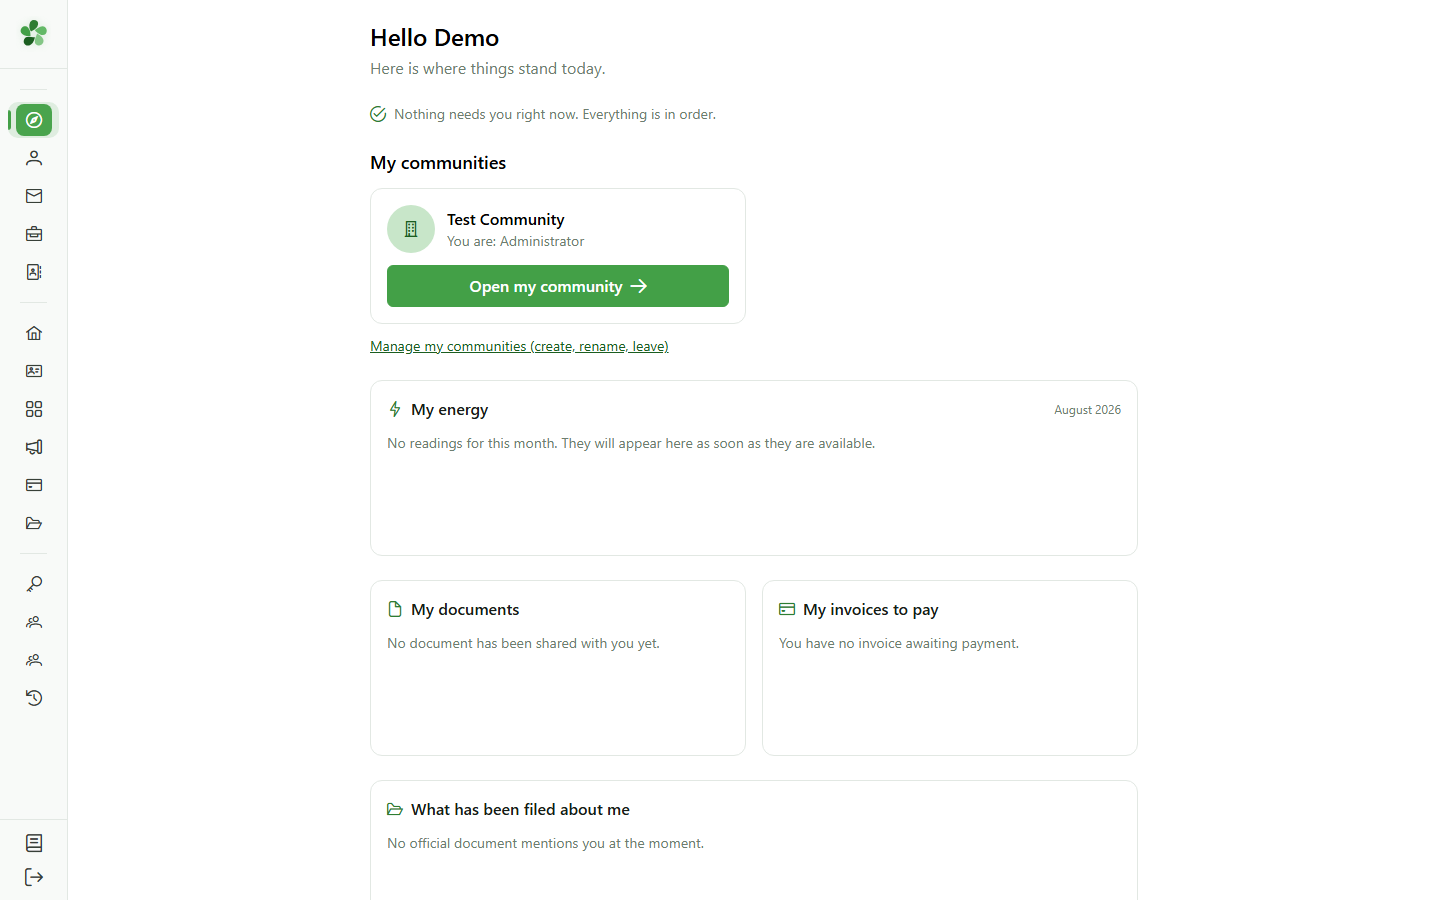
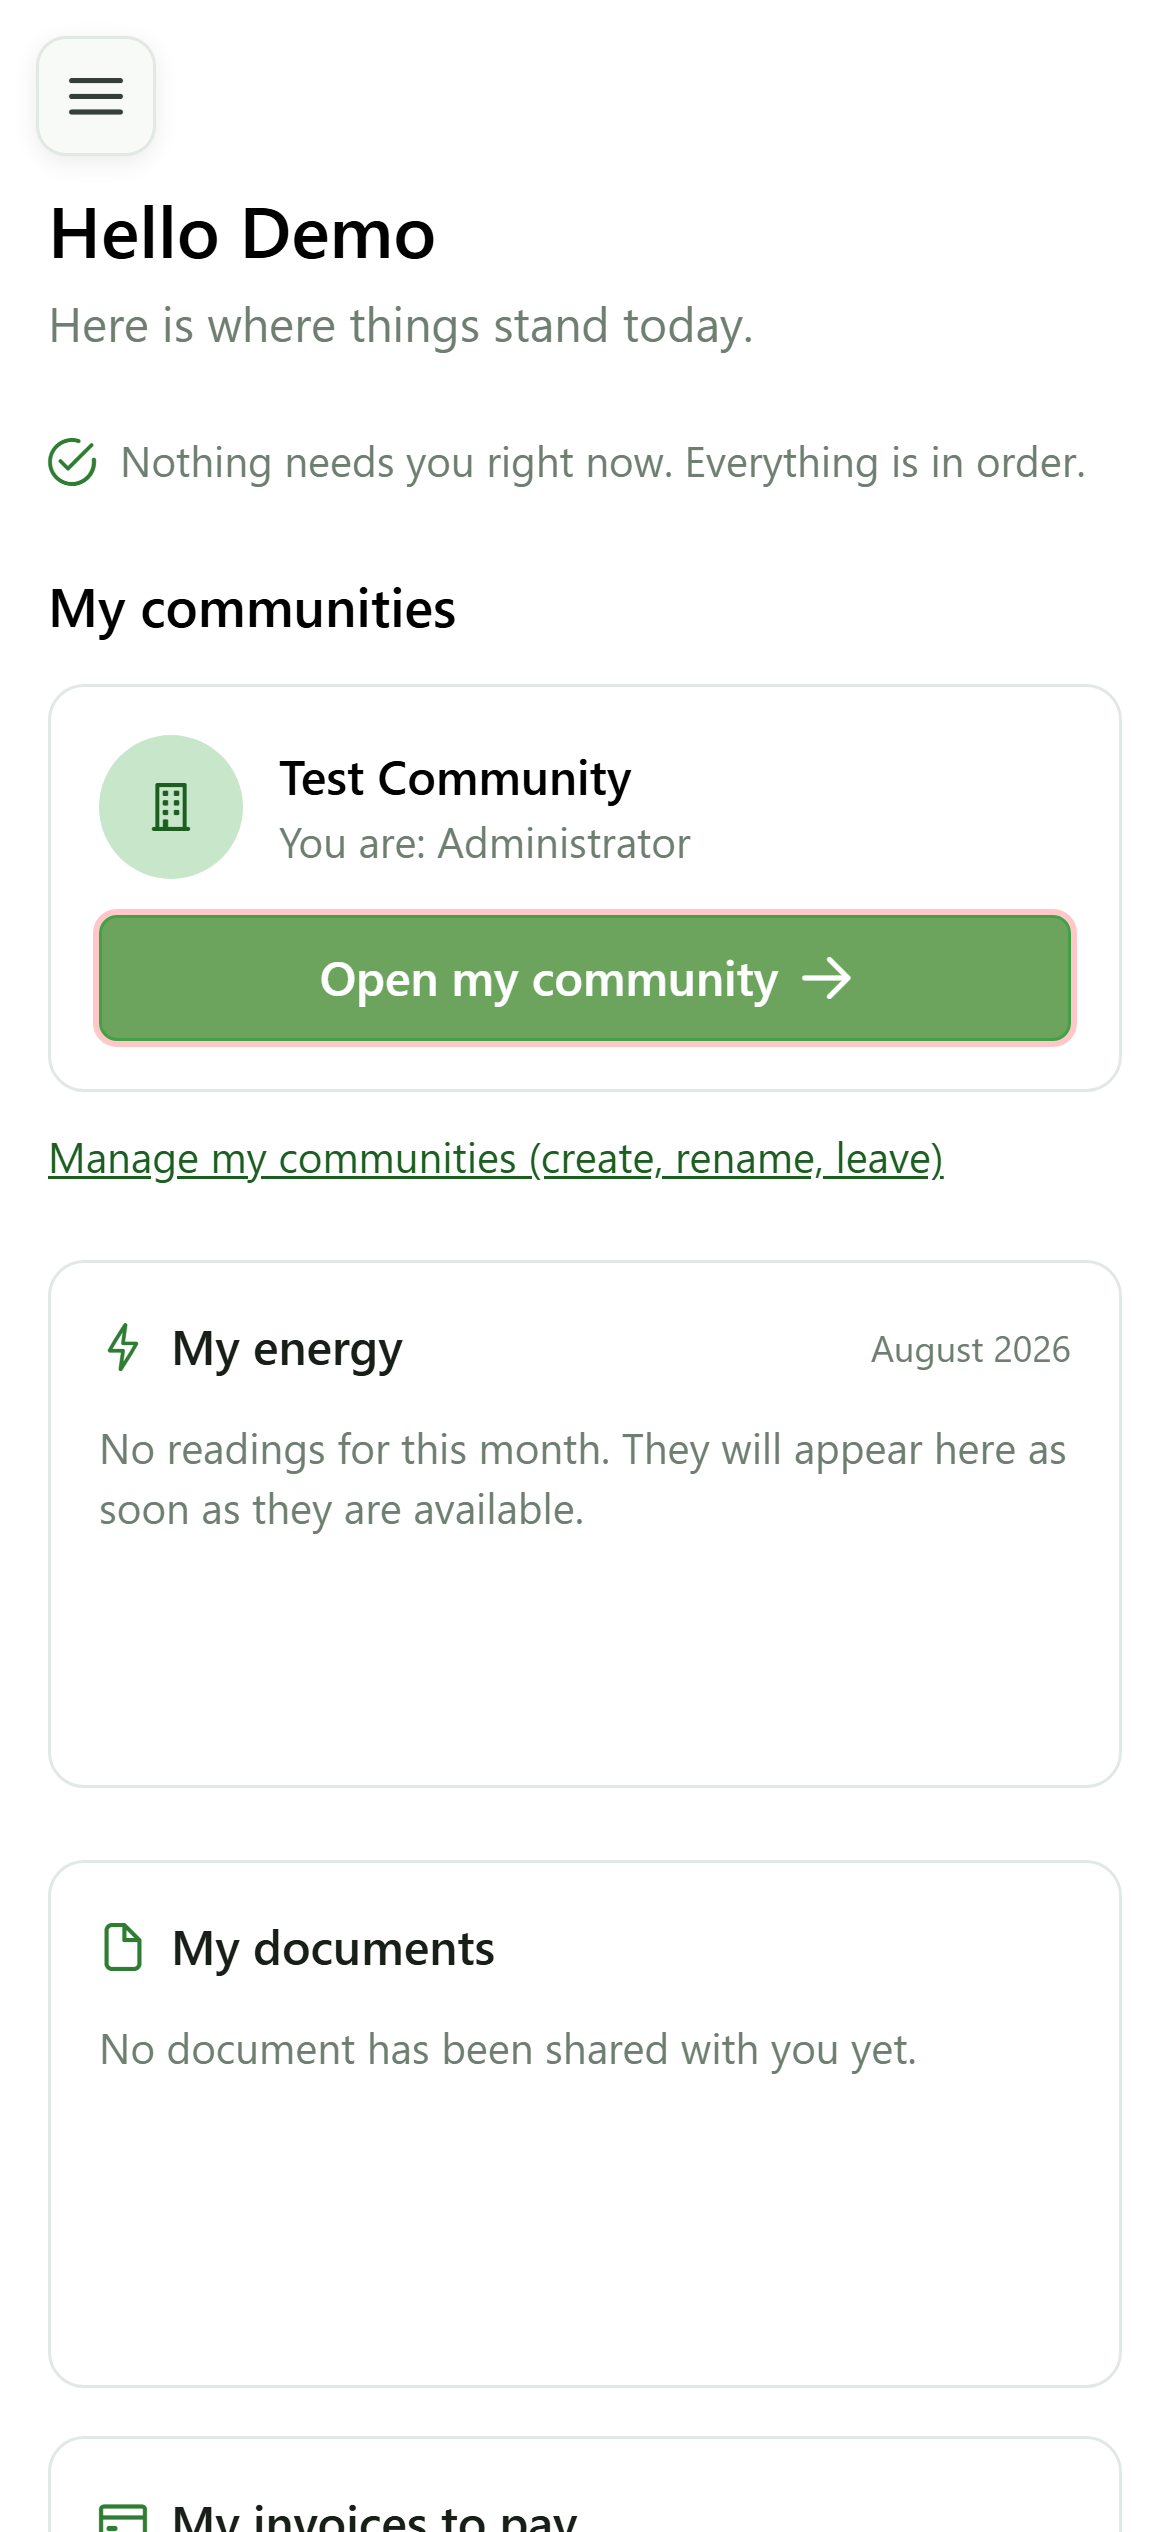
From your home page, open the community you want to work on. It becomes your active community and you land on its dashboard.
2 The dashboard
Overview
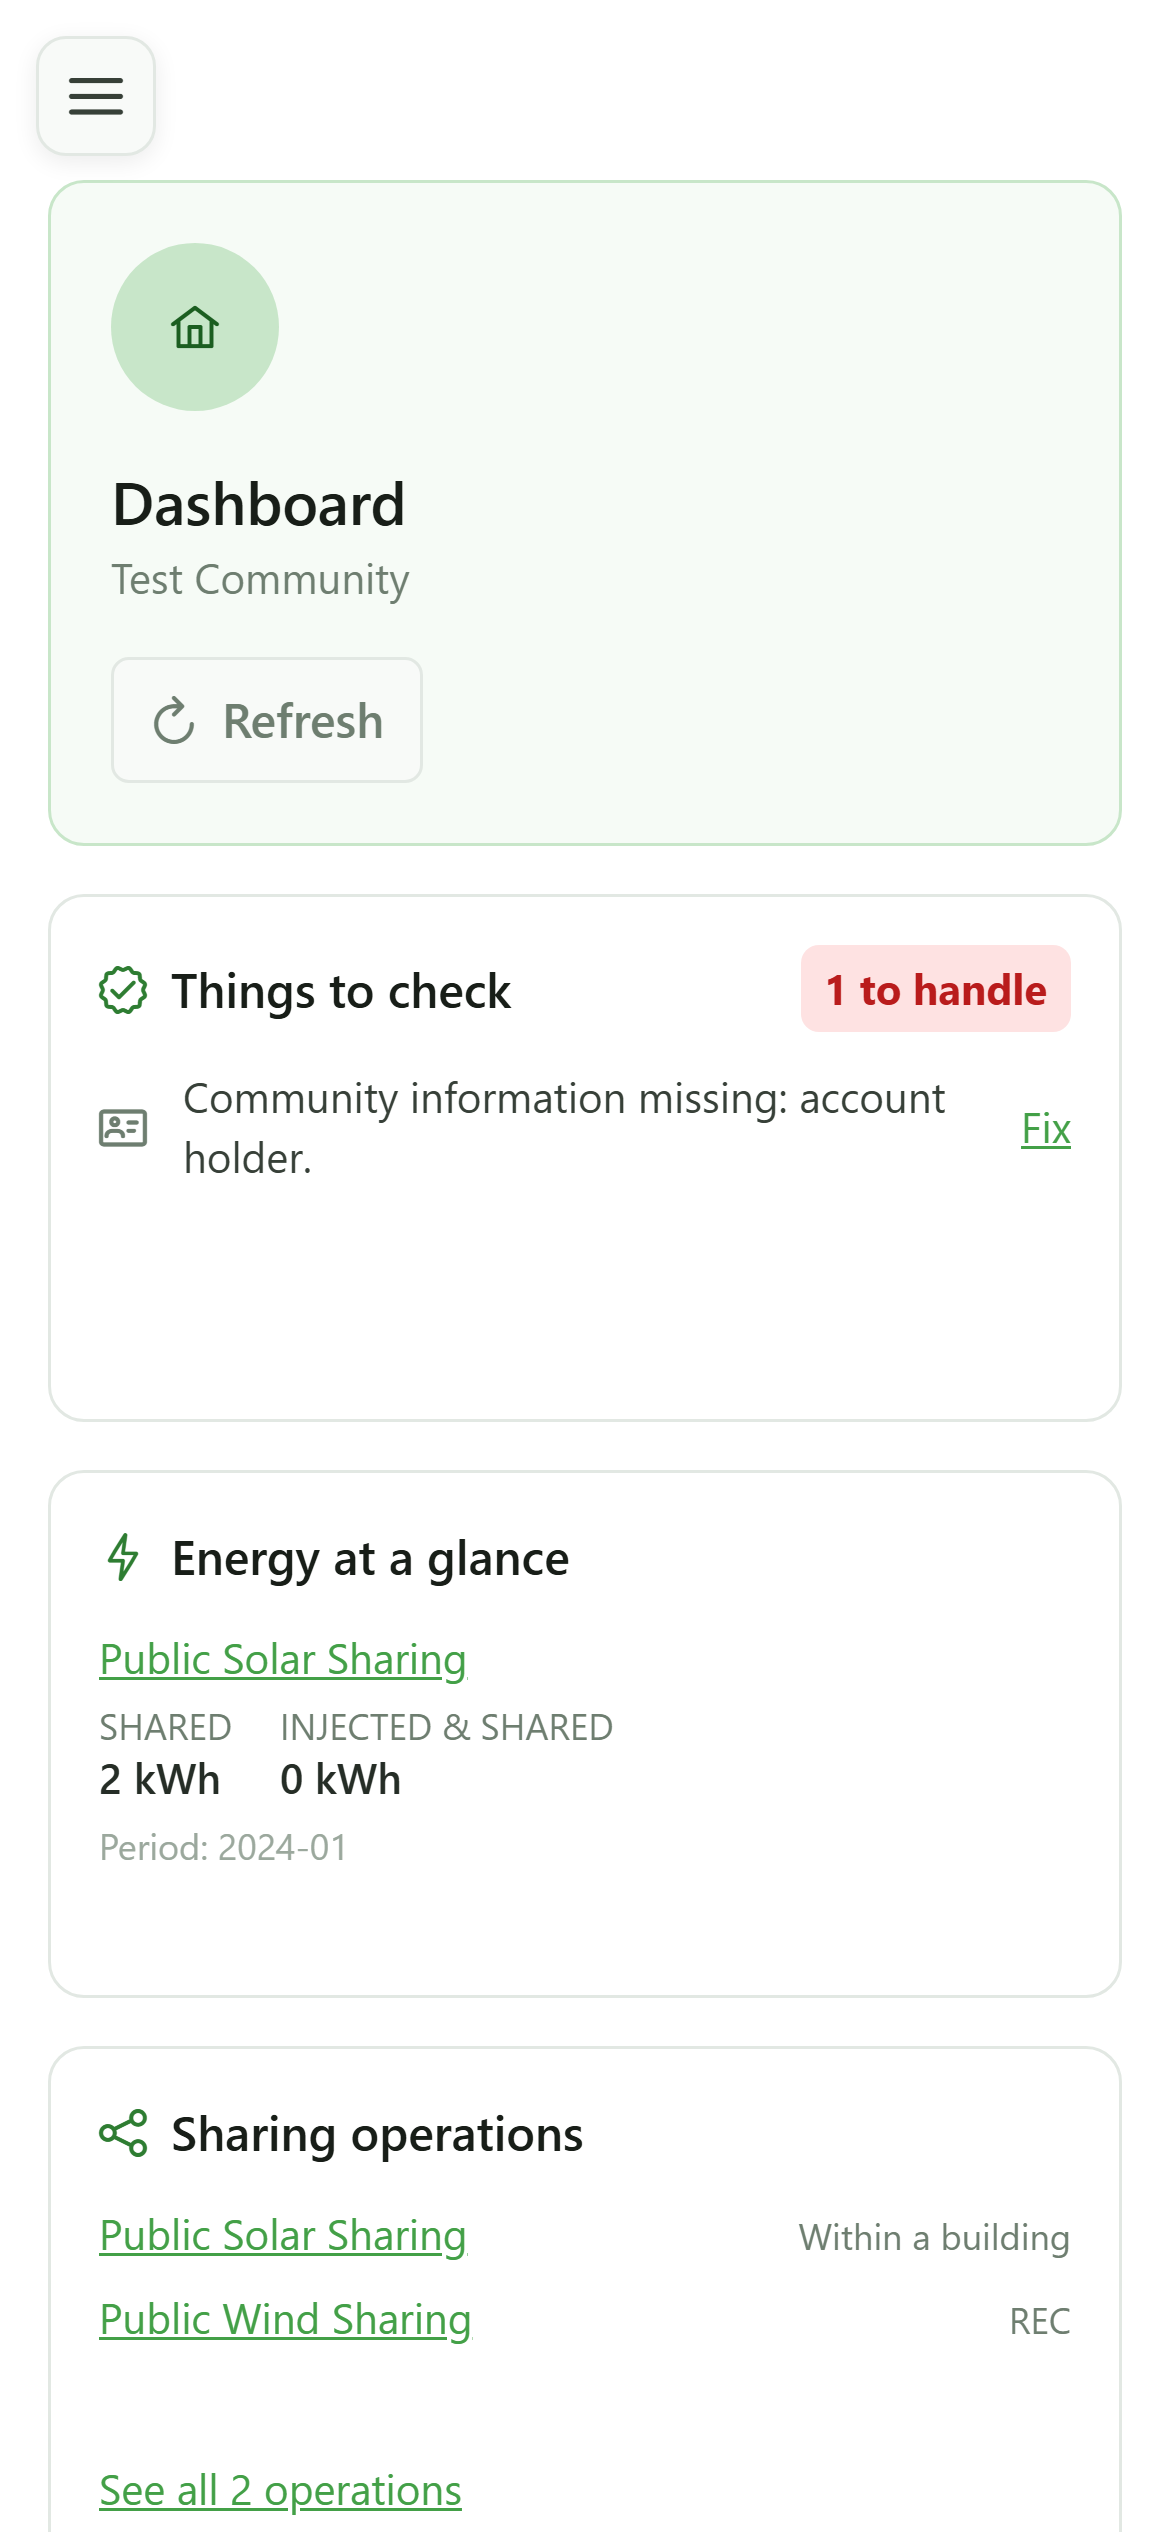
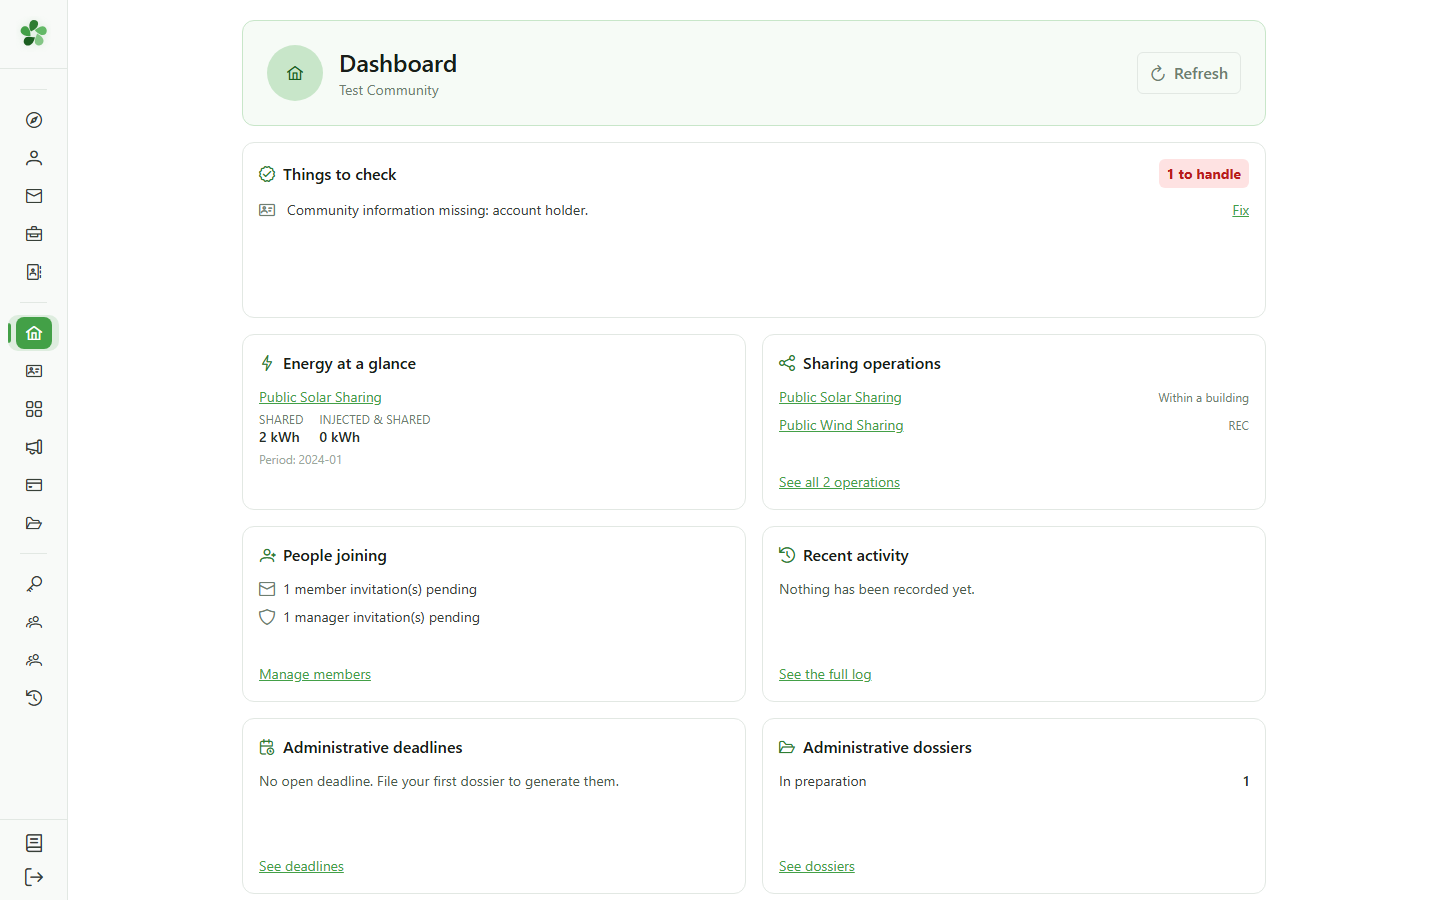
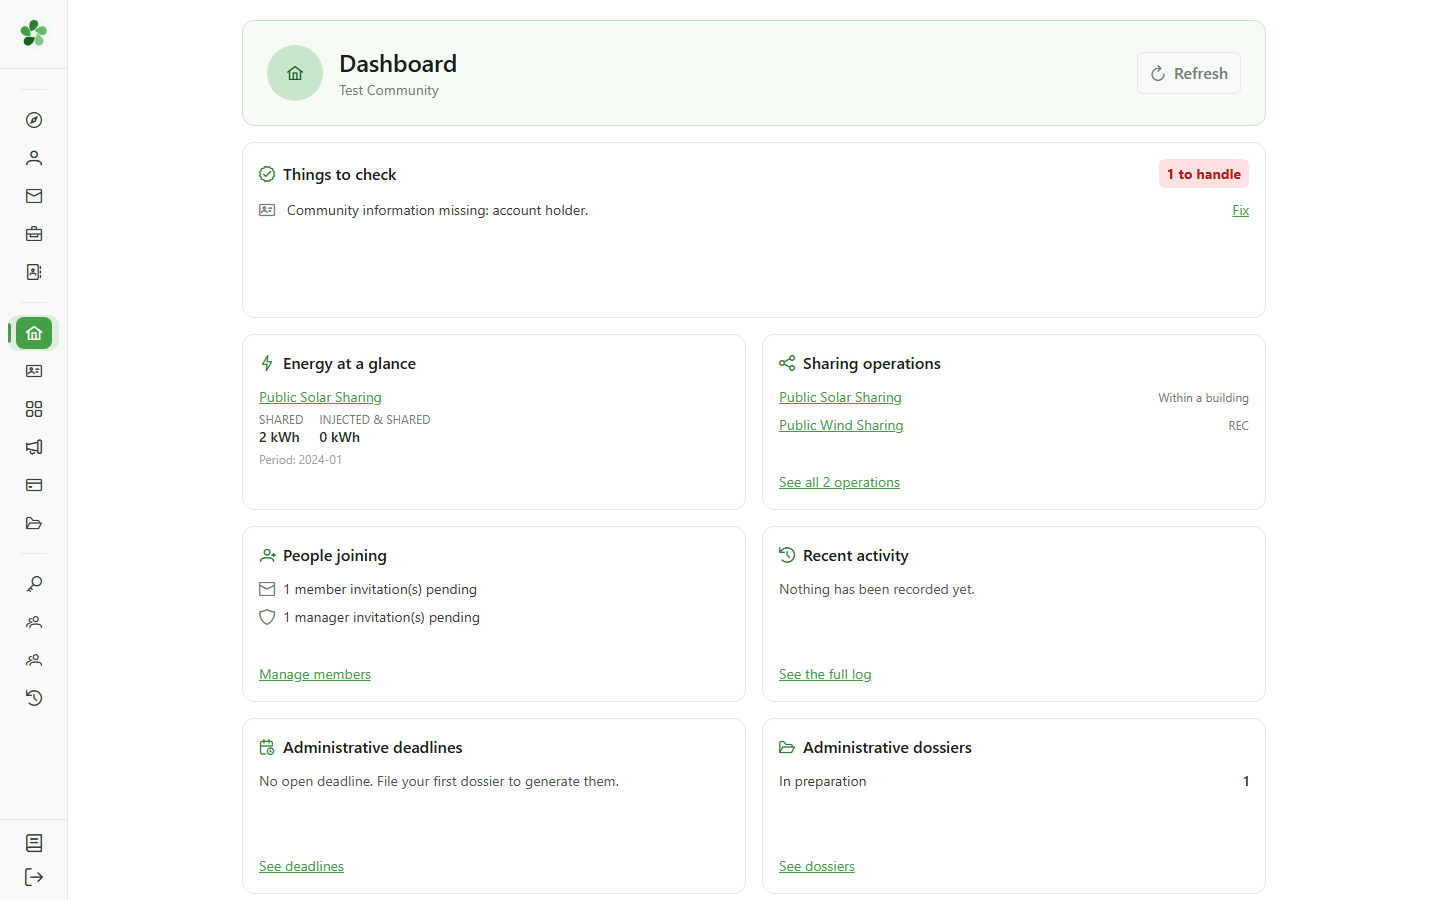
The dashboard sums up the state of the active community: what needs your attention, the shared energy, the operations, and the modules the community is subscribed to.
3 Things to check
Dashboard
The first tile gathers what is blocking, or about to: missing legal details, meters waiting on the grid operator, operations without an allocation key. Every row links straight to the screen where you fix it.
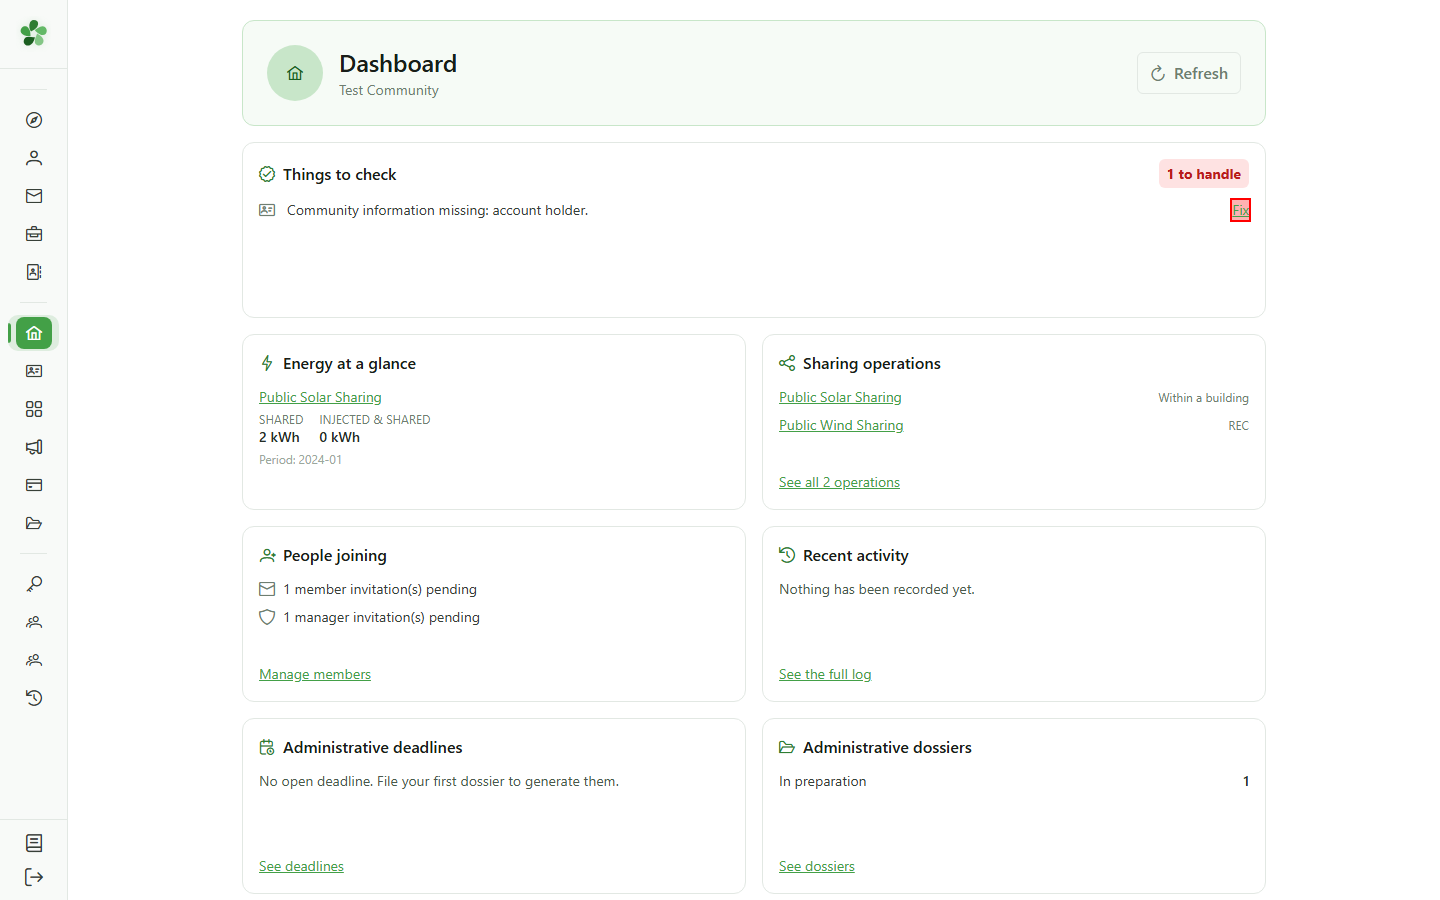
4 Fix it in one click
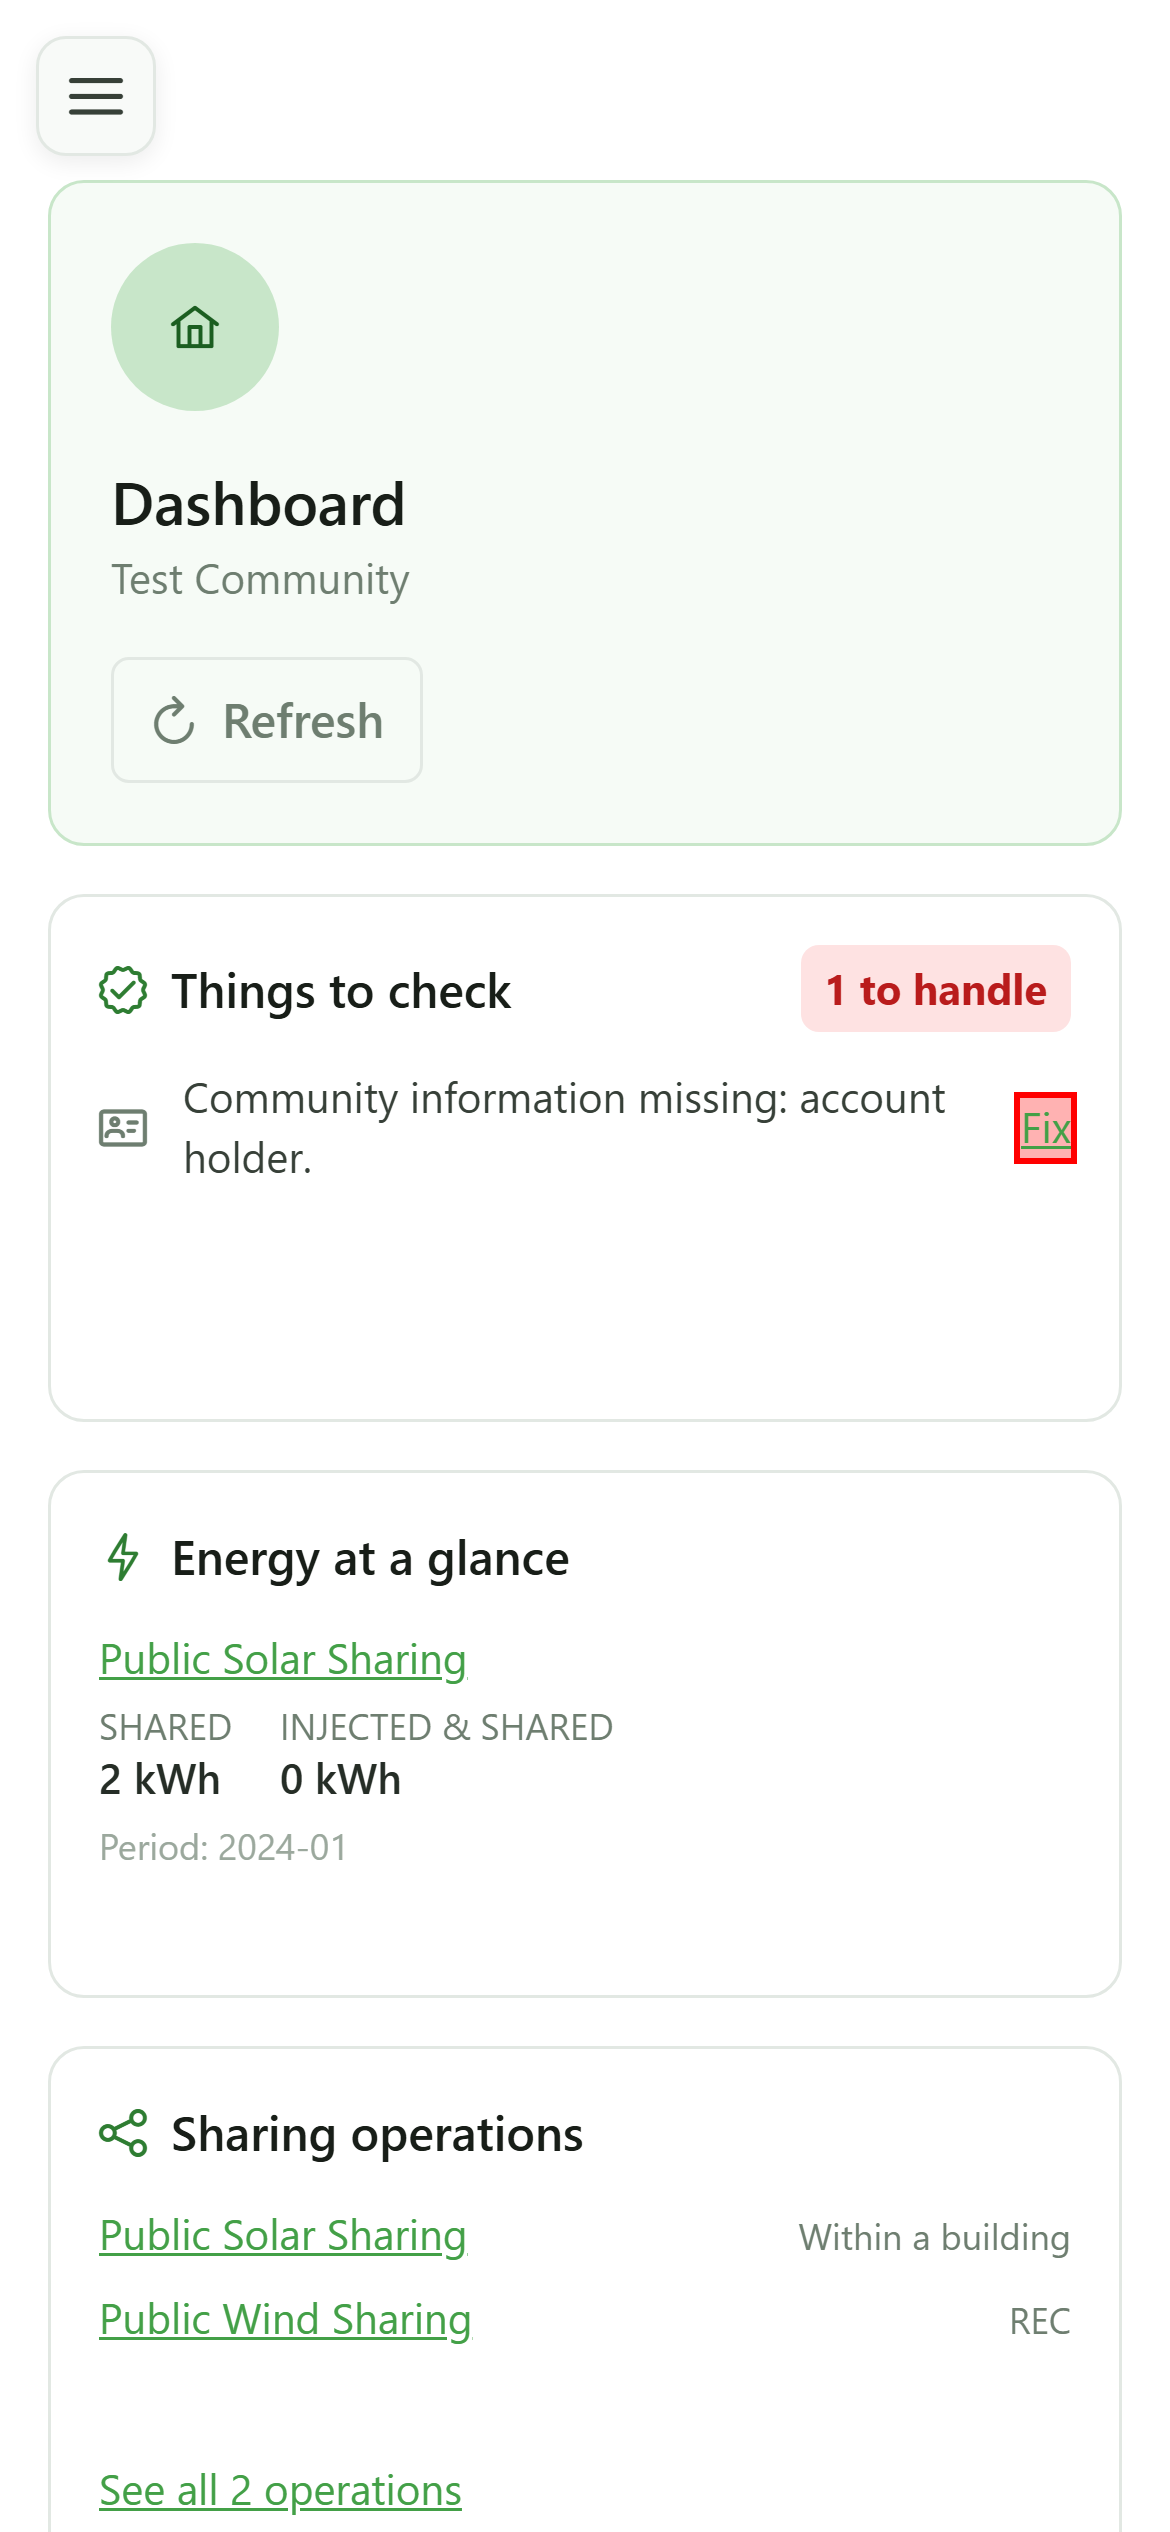
Things to check
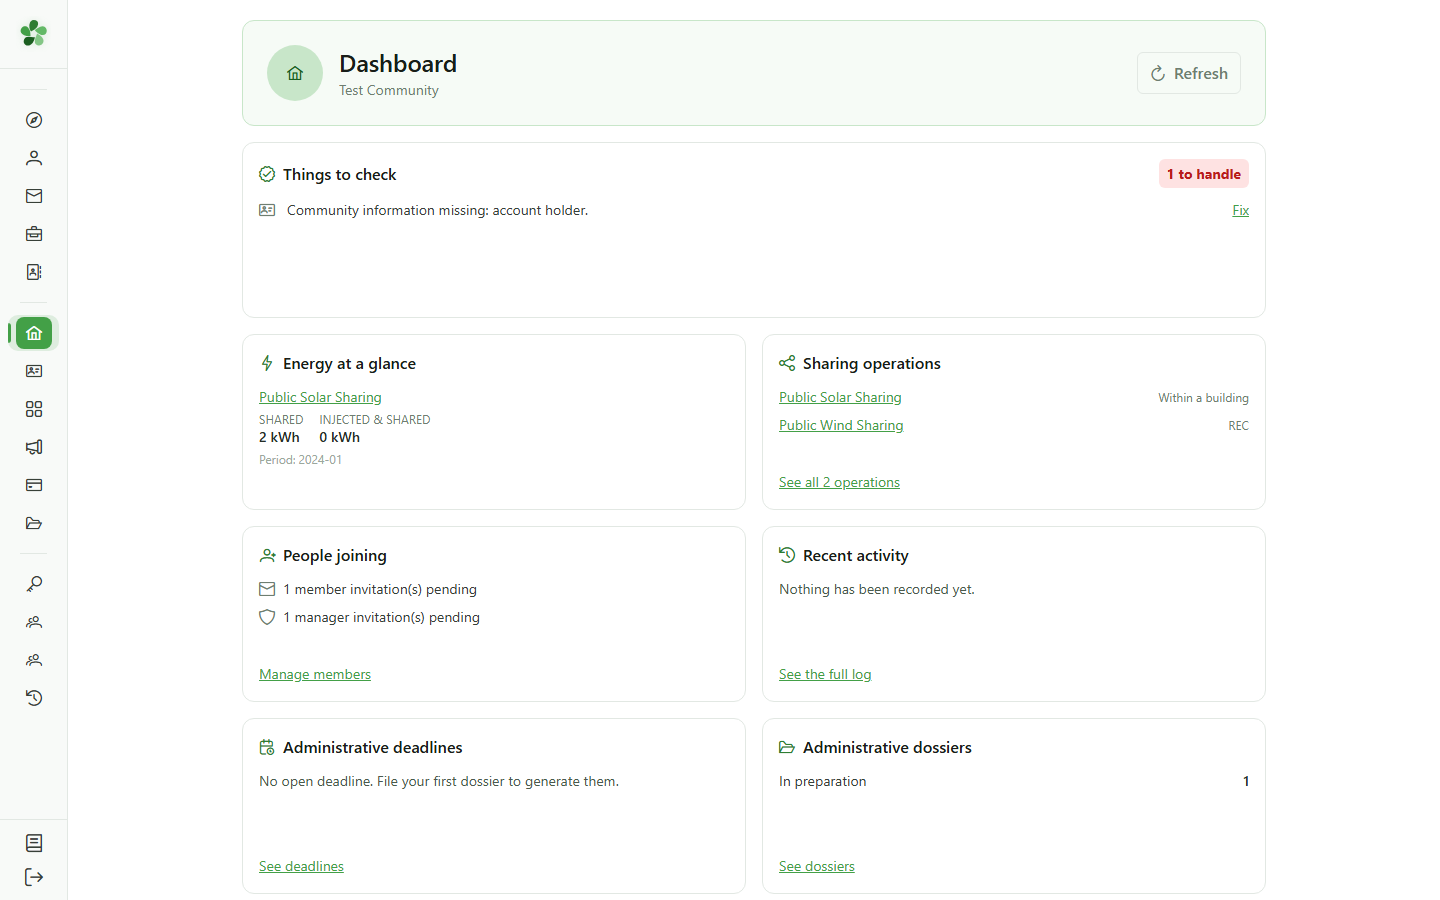
Click "Fix": you land on the page in question — here, the community information.
5 Energy at a glance
Dashboard
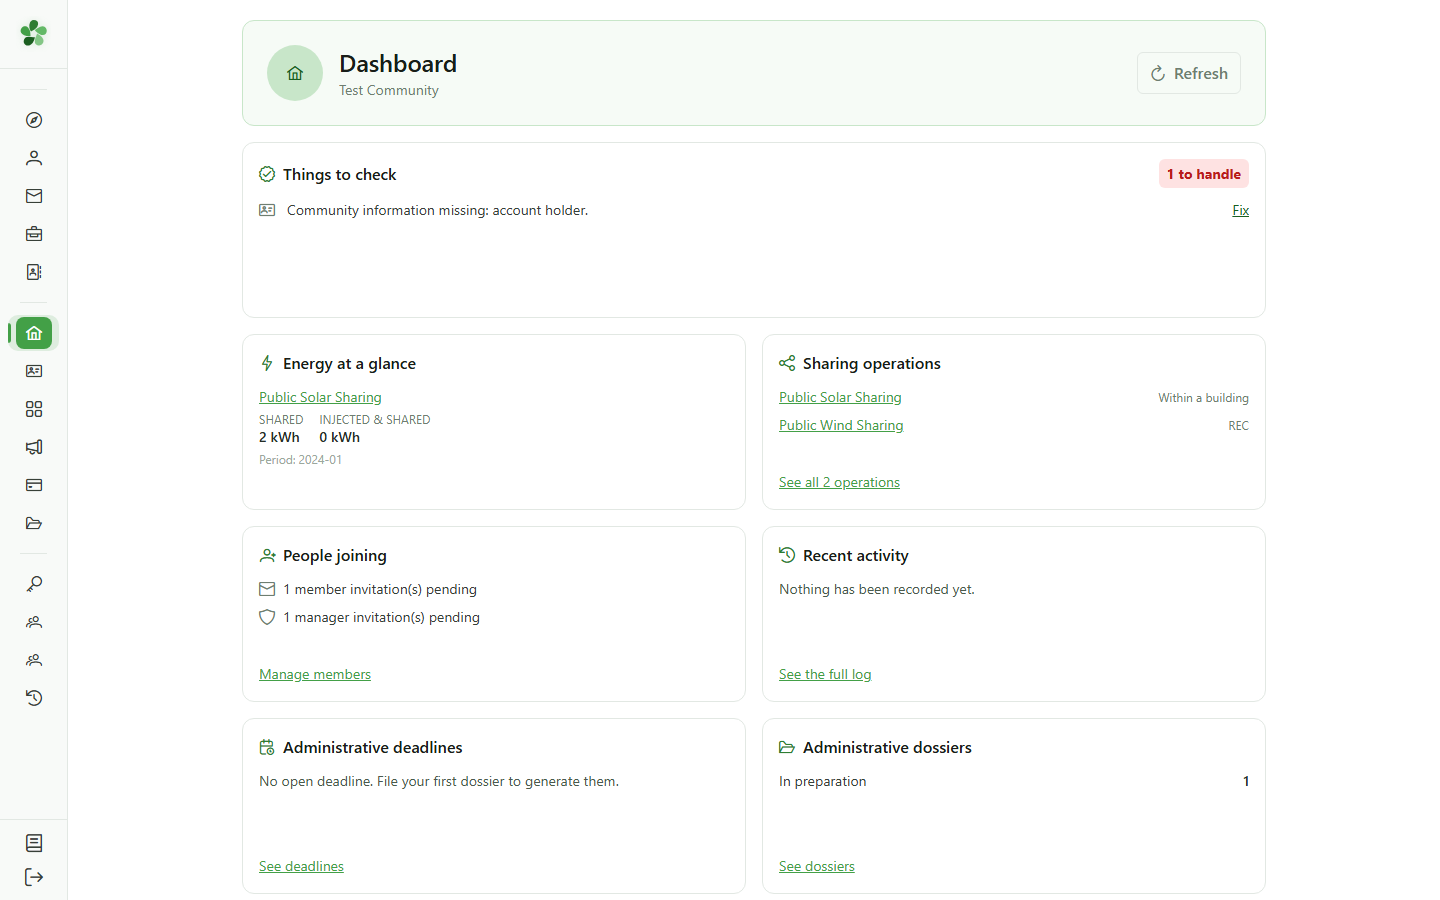
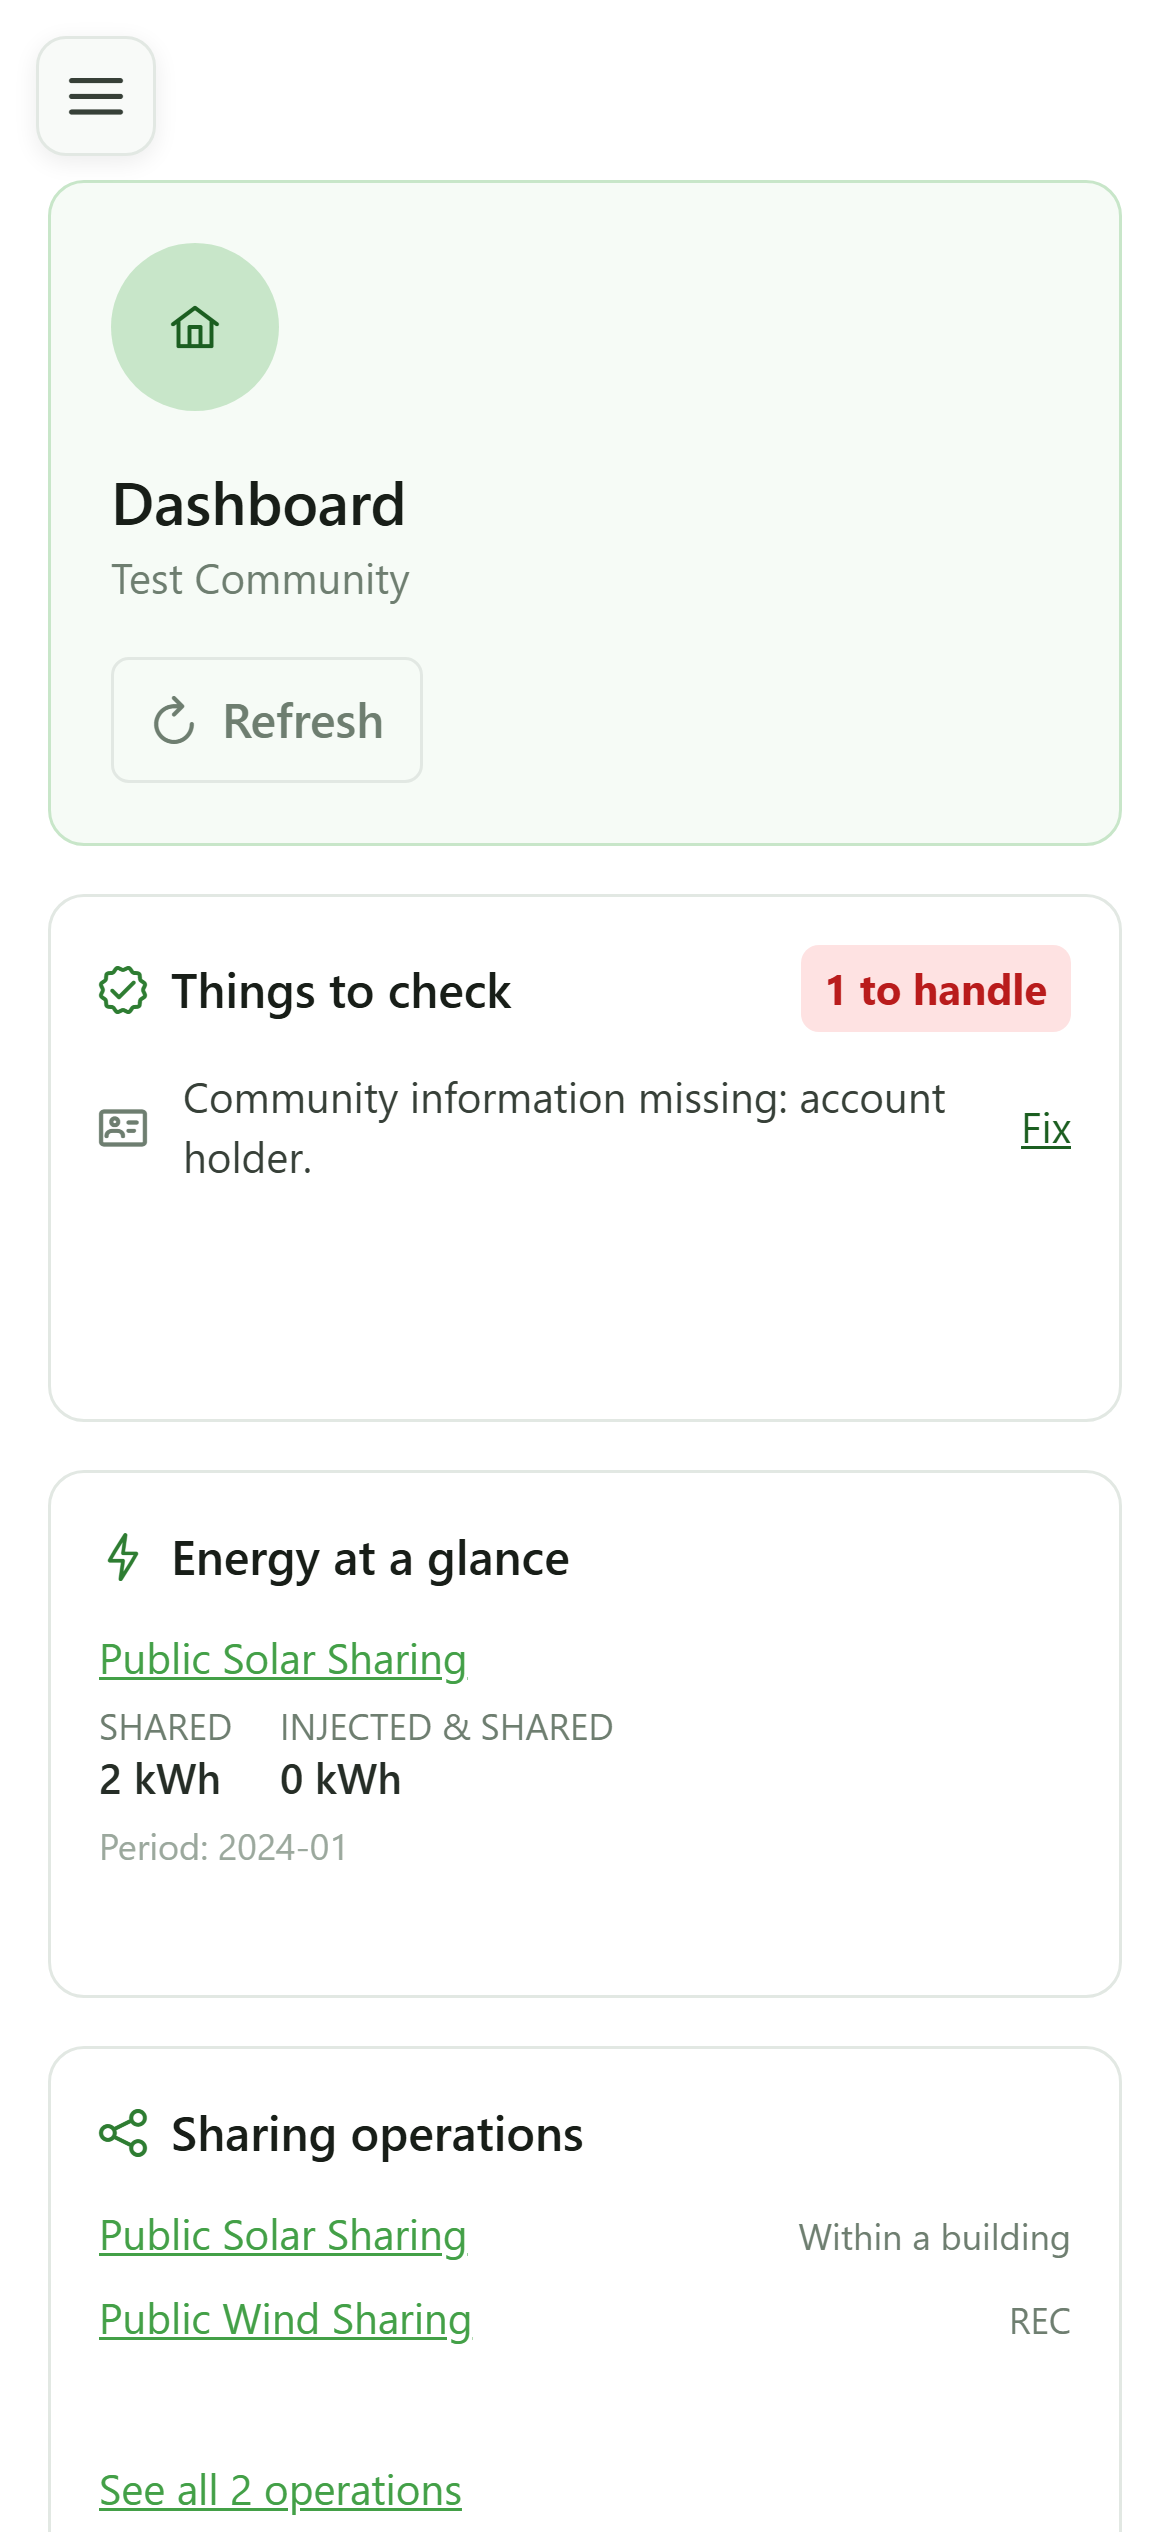
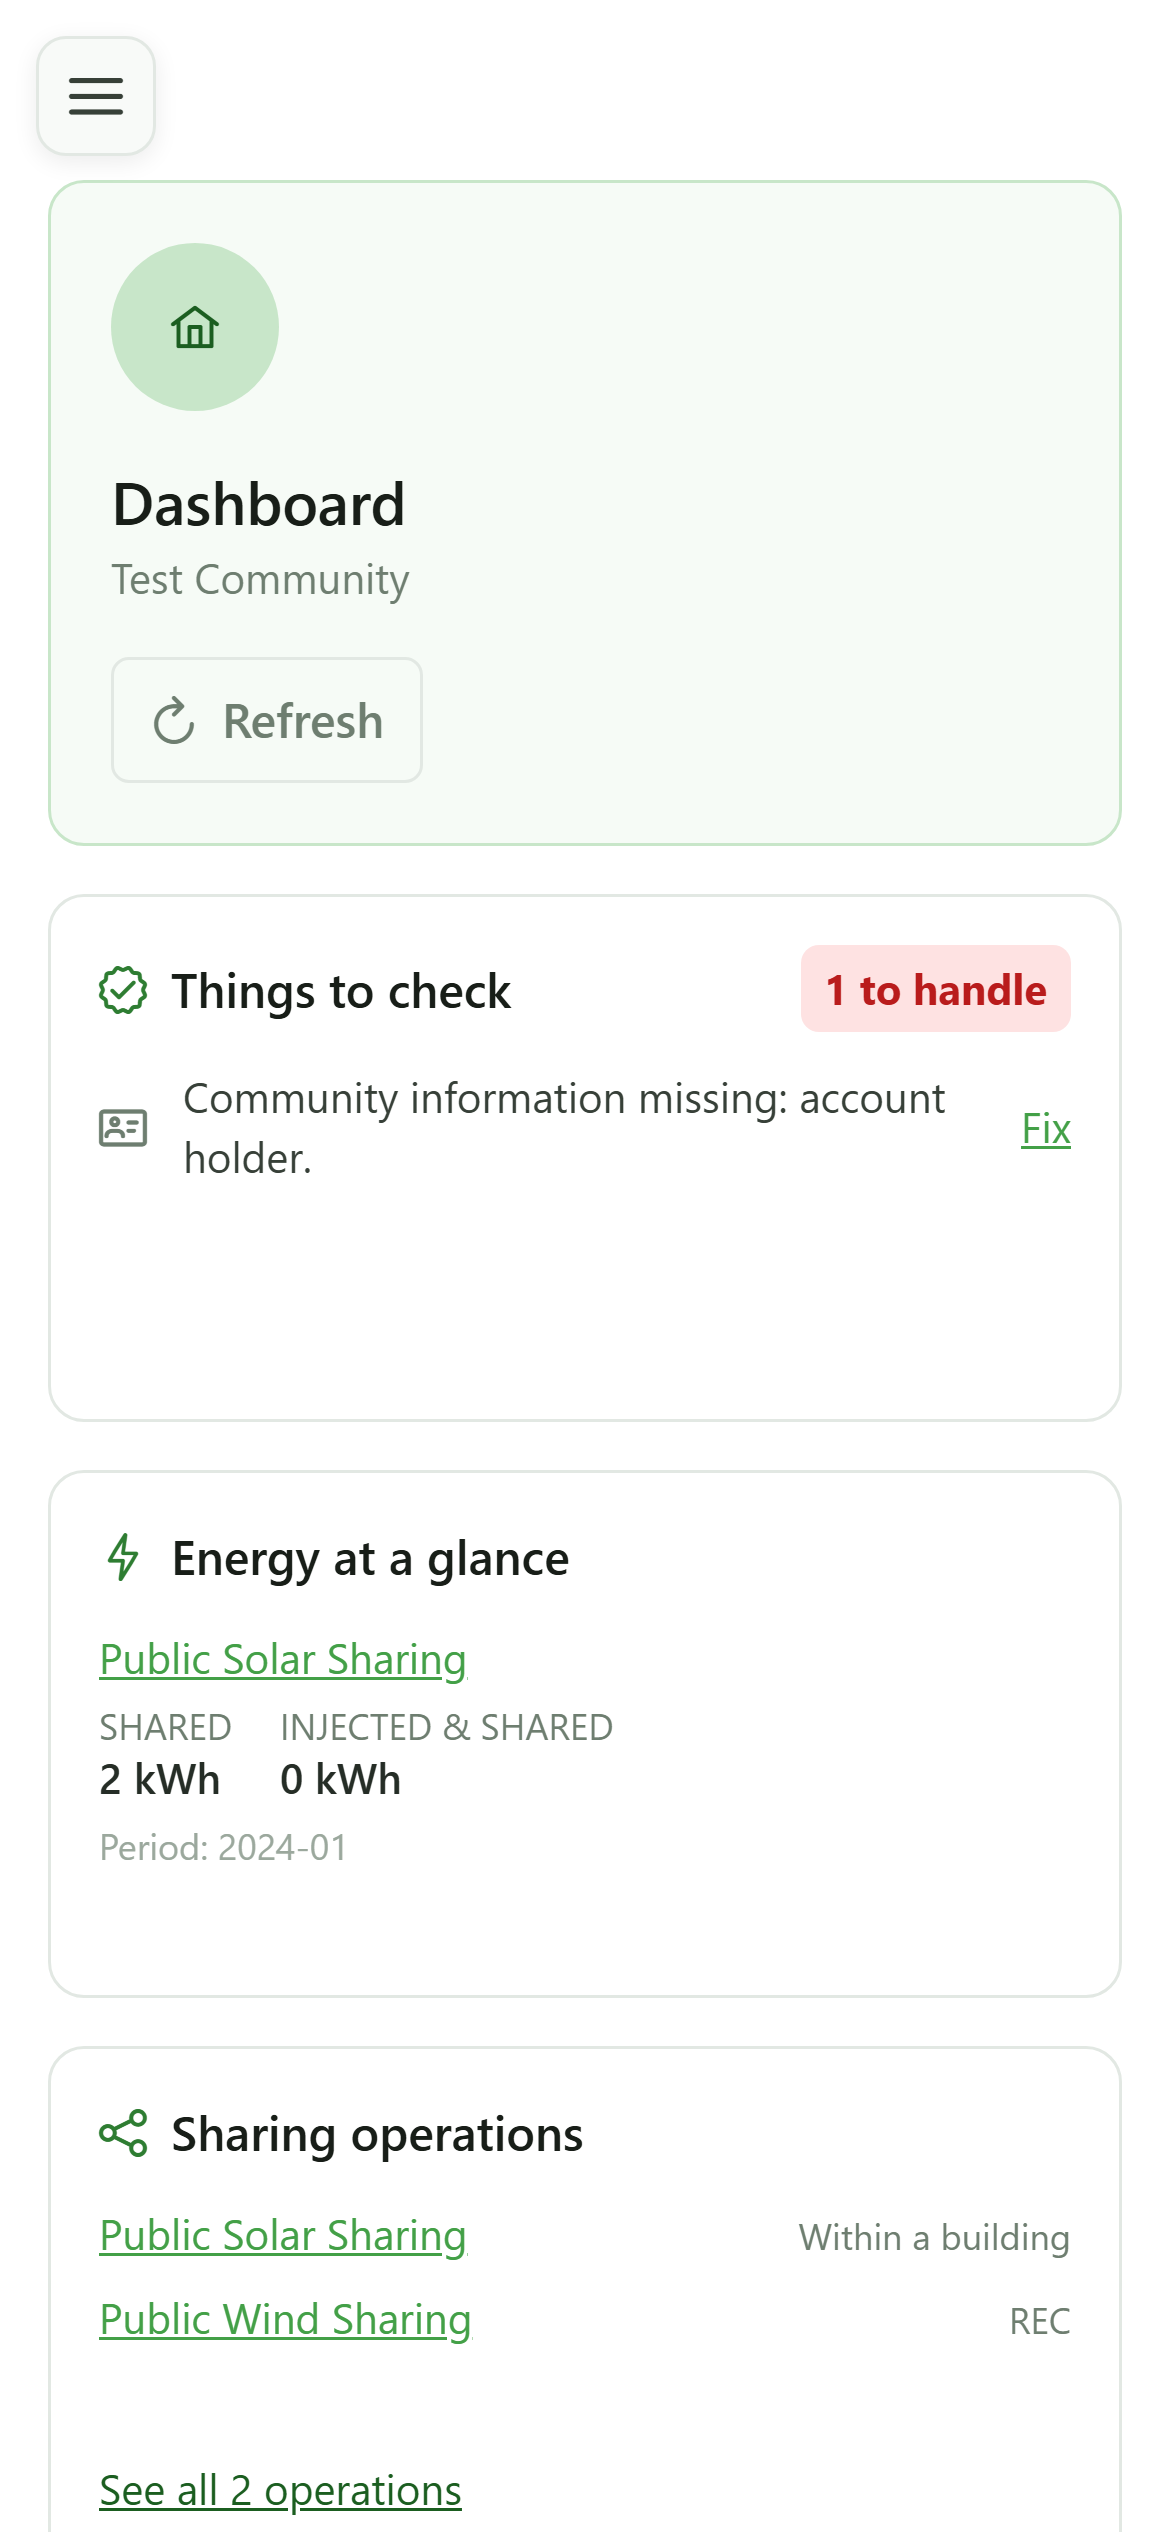
For each sharing operation, the tile shows the shared and injected energy over the latest period with data. The operation name links to its page.
6 Sharing operations
Dashboard
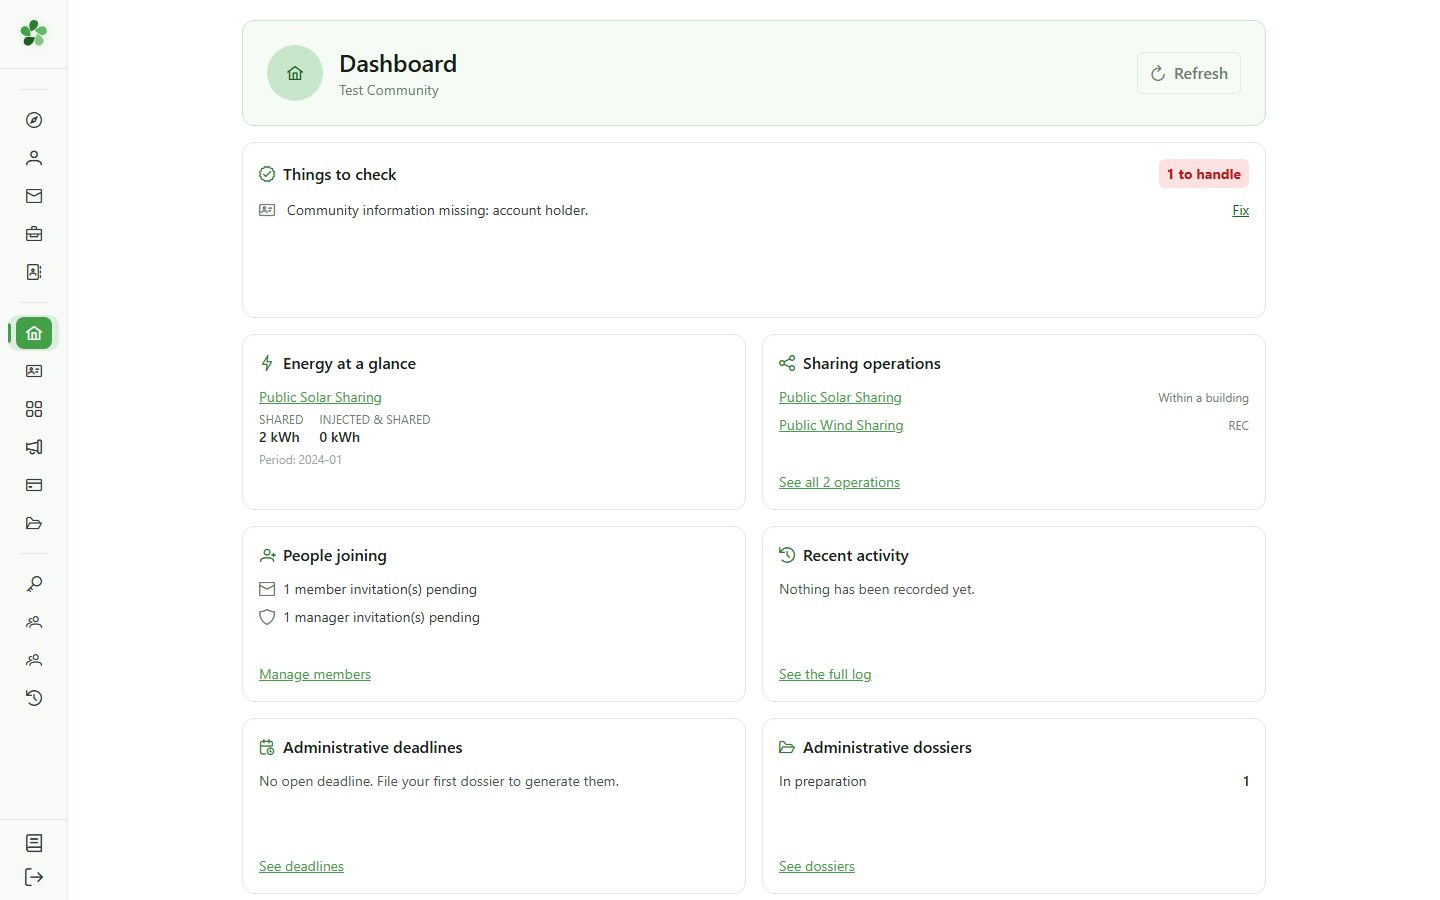
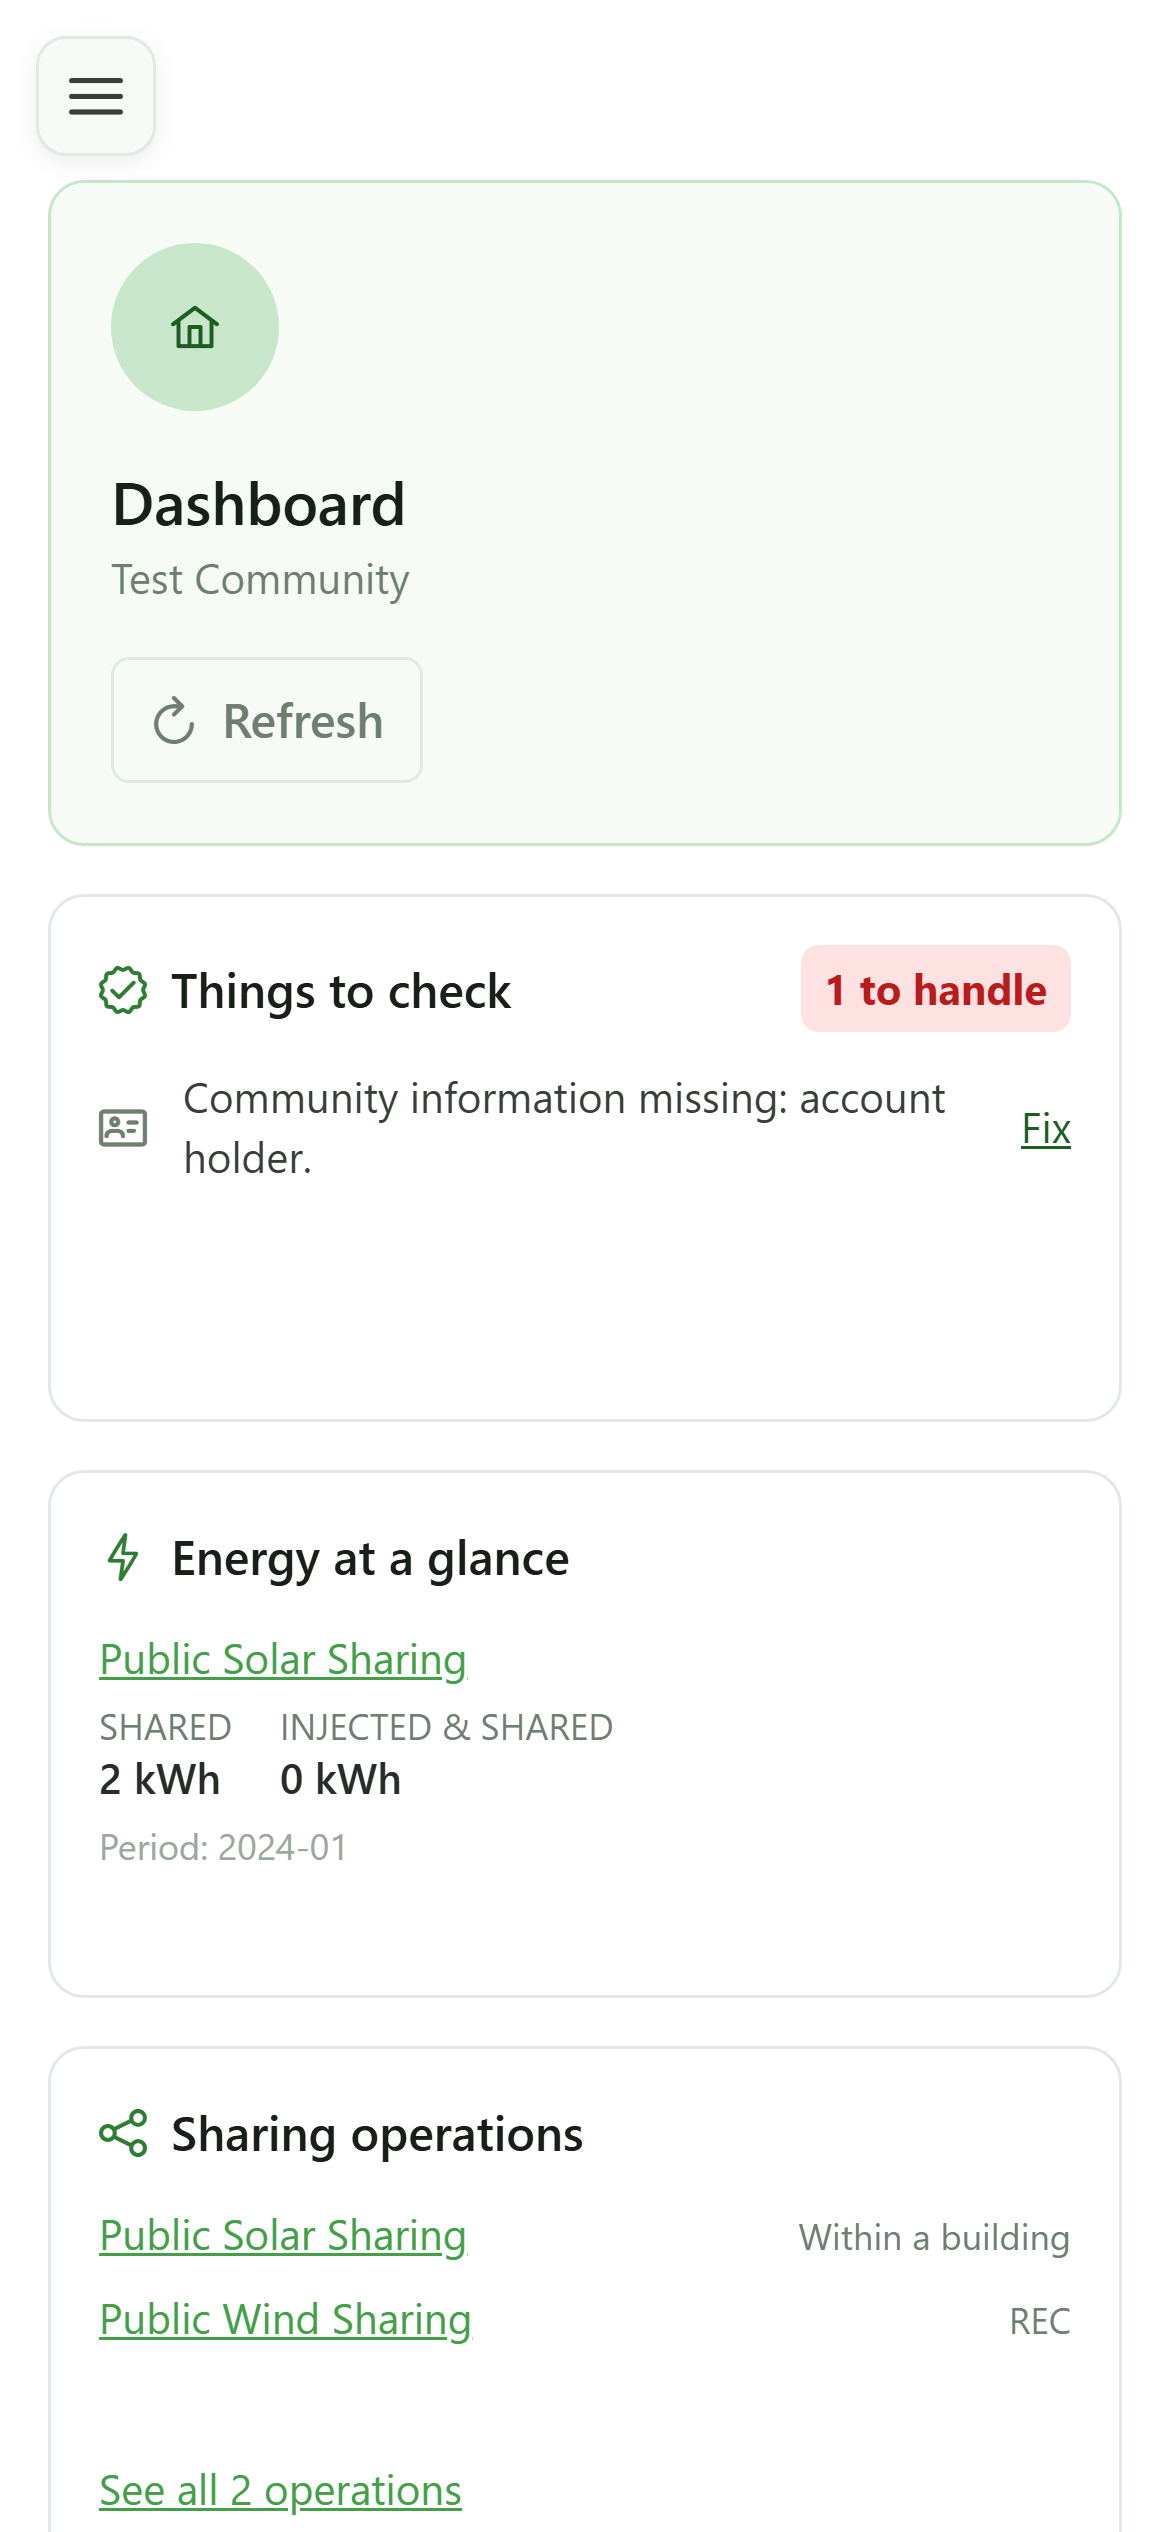
The tile lists the community's operations with their type. The link at the bottom opens the full list.
7 See every operation
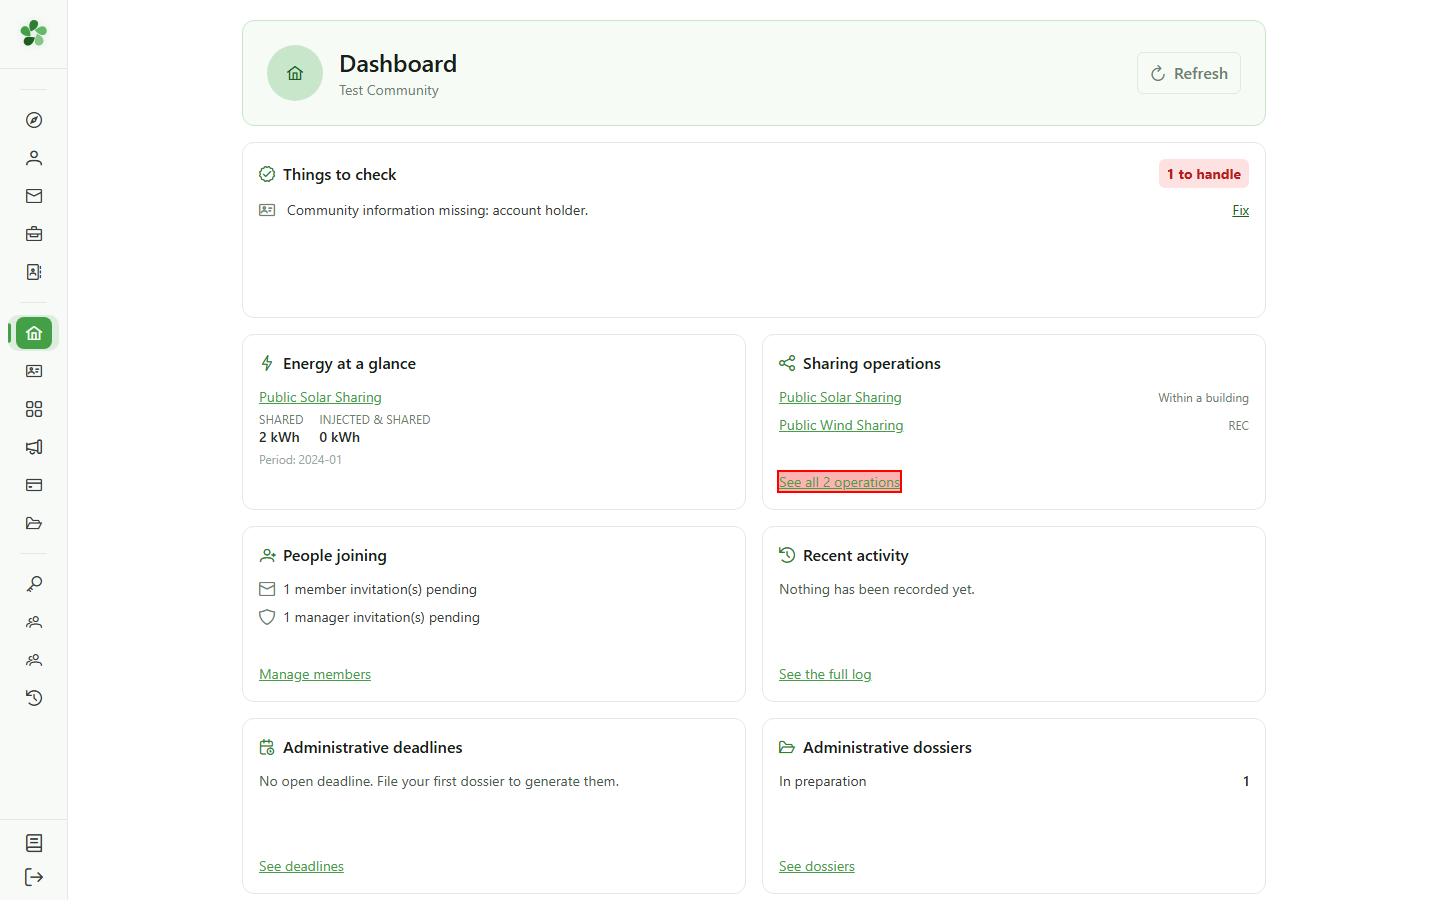
Sharing operations
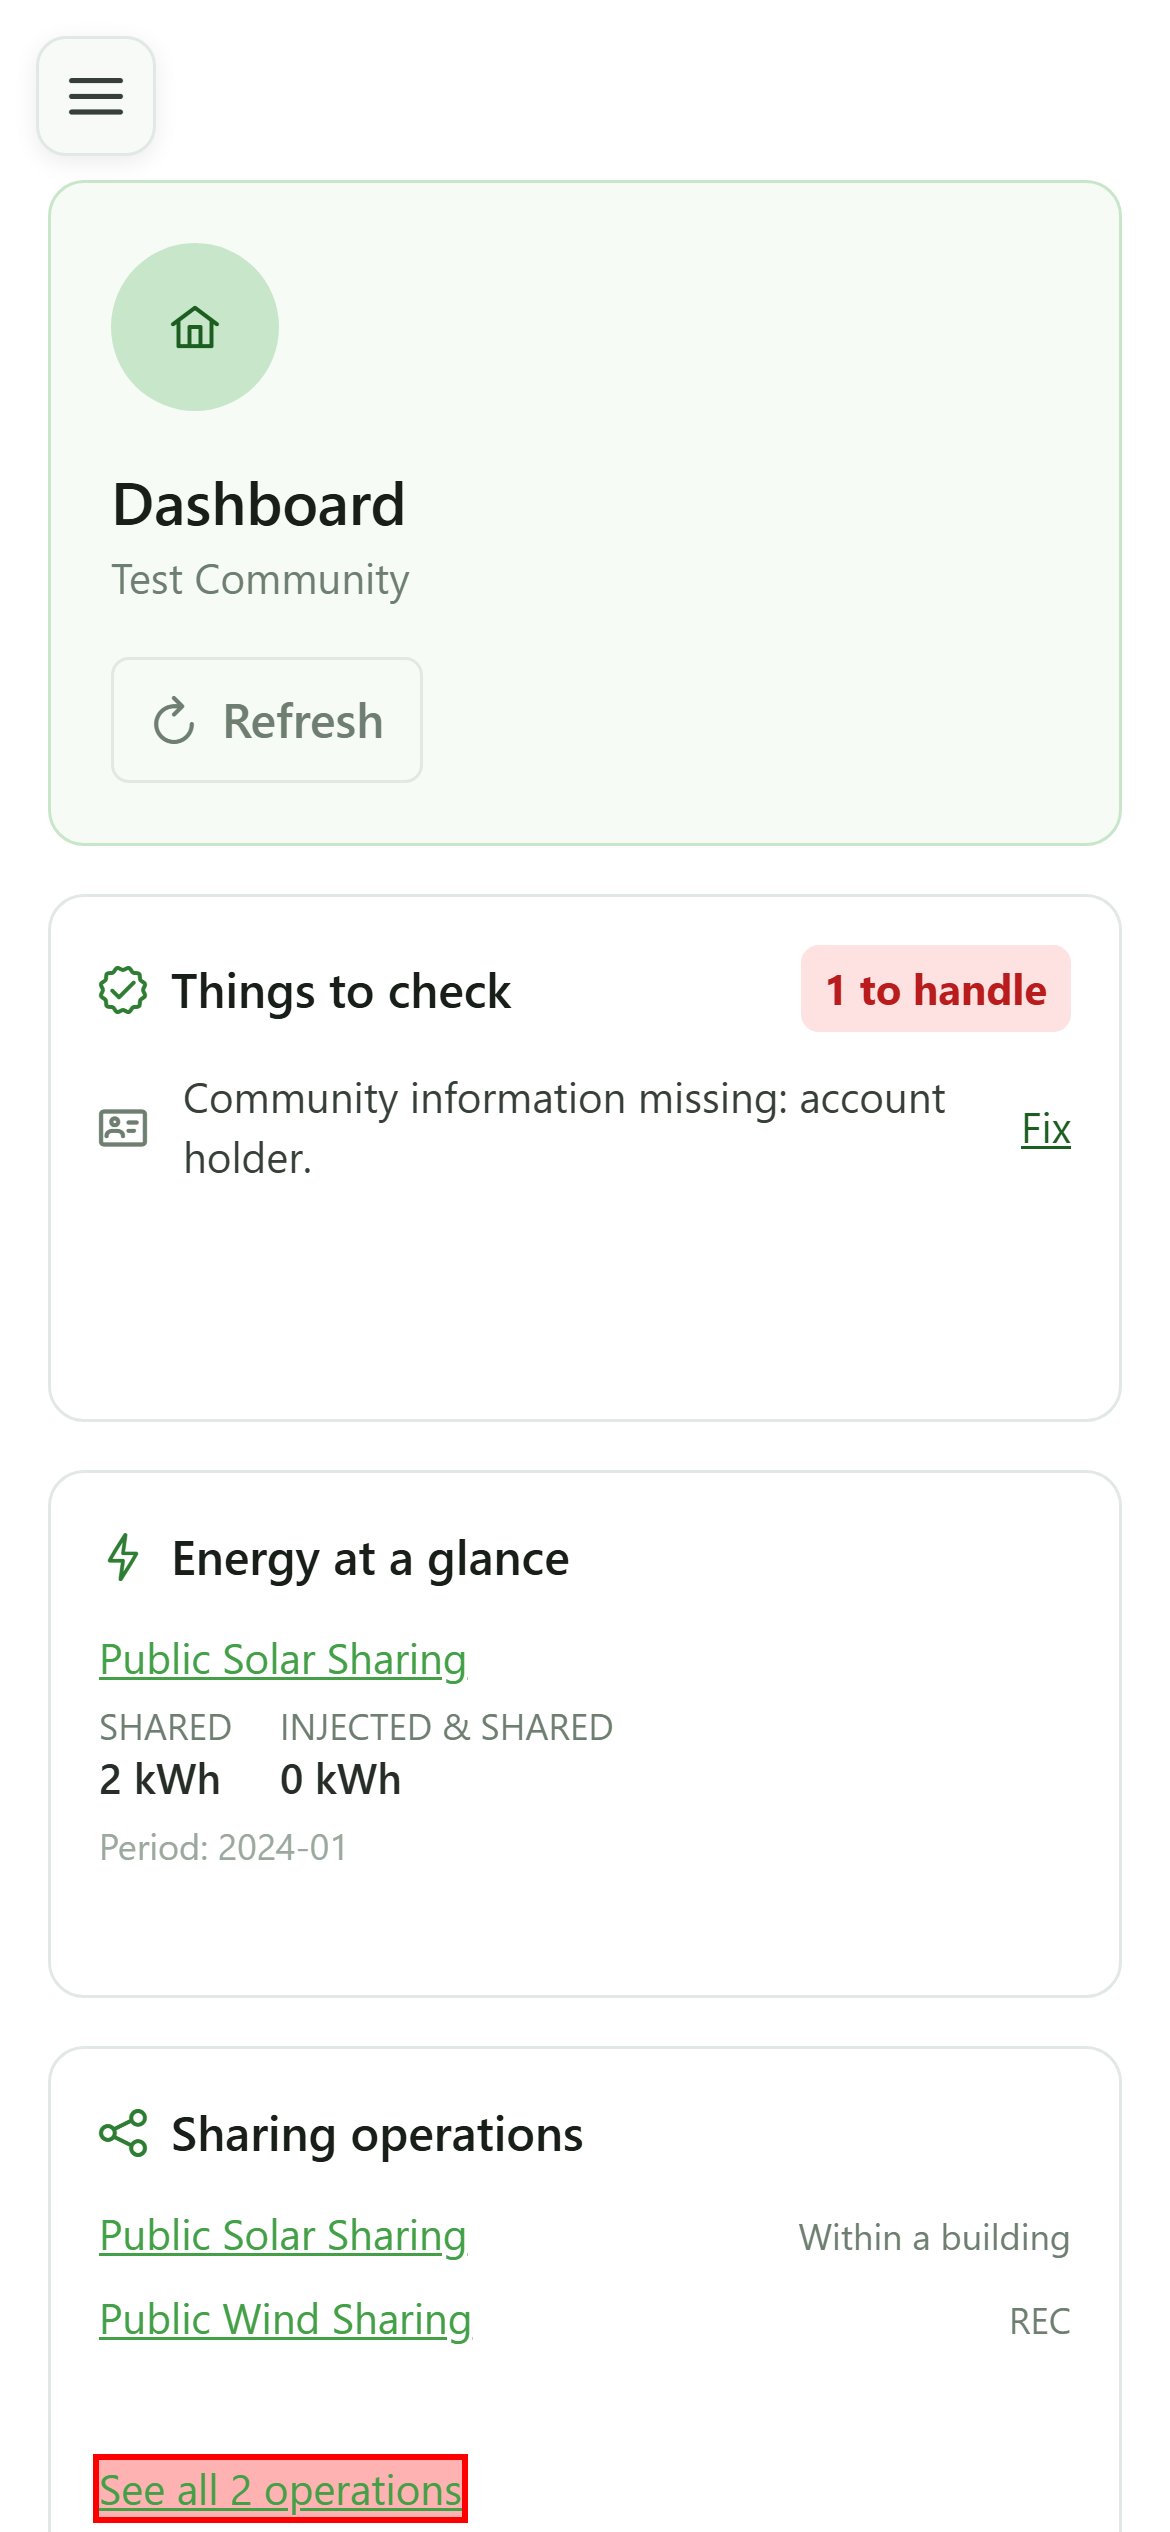
The link takes you to the full sharing-operation management screen.
8 Arrivals and recent activity
Dashboard
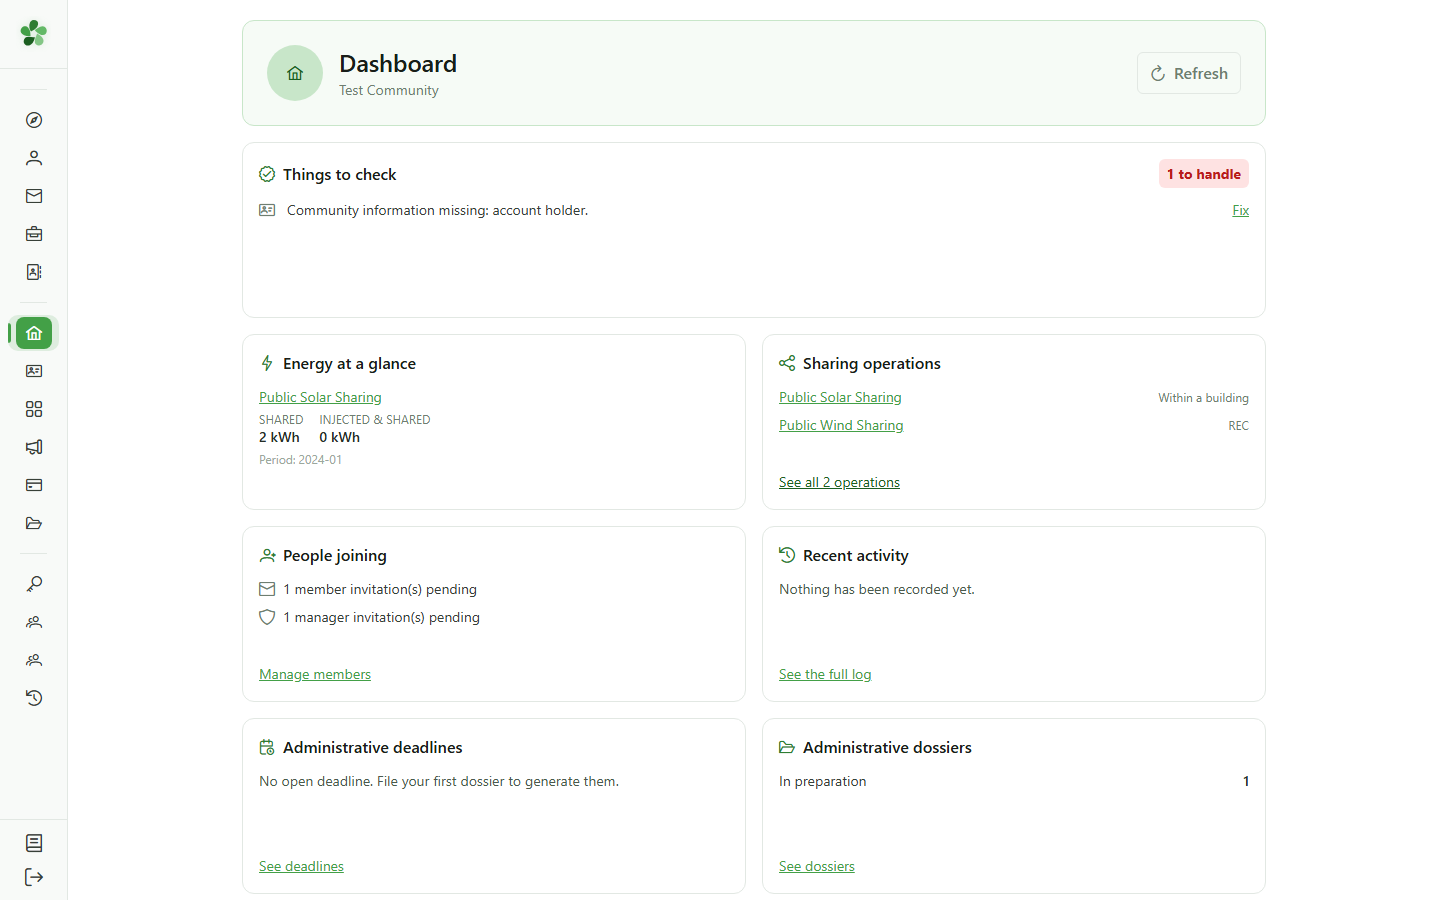
"People joining" counts the invitations sent and the records still to be filled in. "Recent activity" shows the latest actions recorded in the community's audit log.
9 The enabled modules
Dashboard
Billing, news, dossiers and administrative deadlines only appear when the community is subscribed to the matching module. A community with no subscription simply does not see these tiles.
10 Available modules
Dashboard
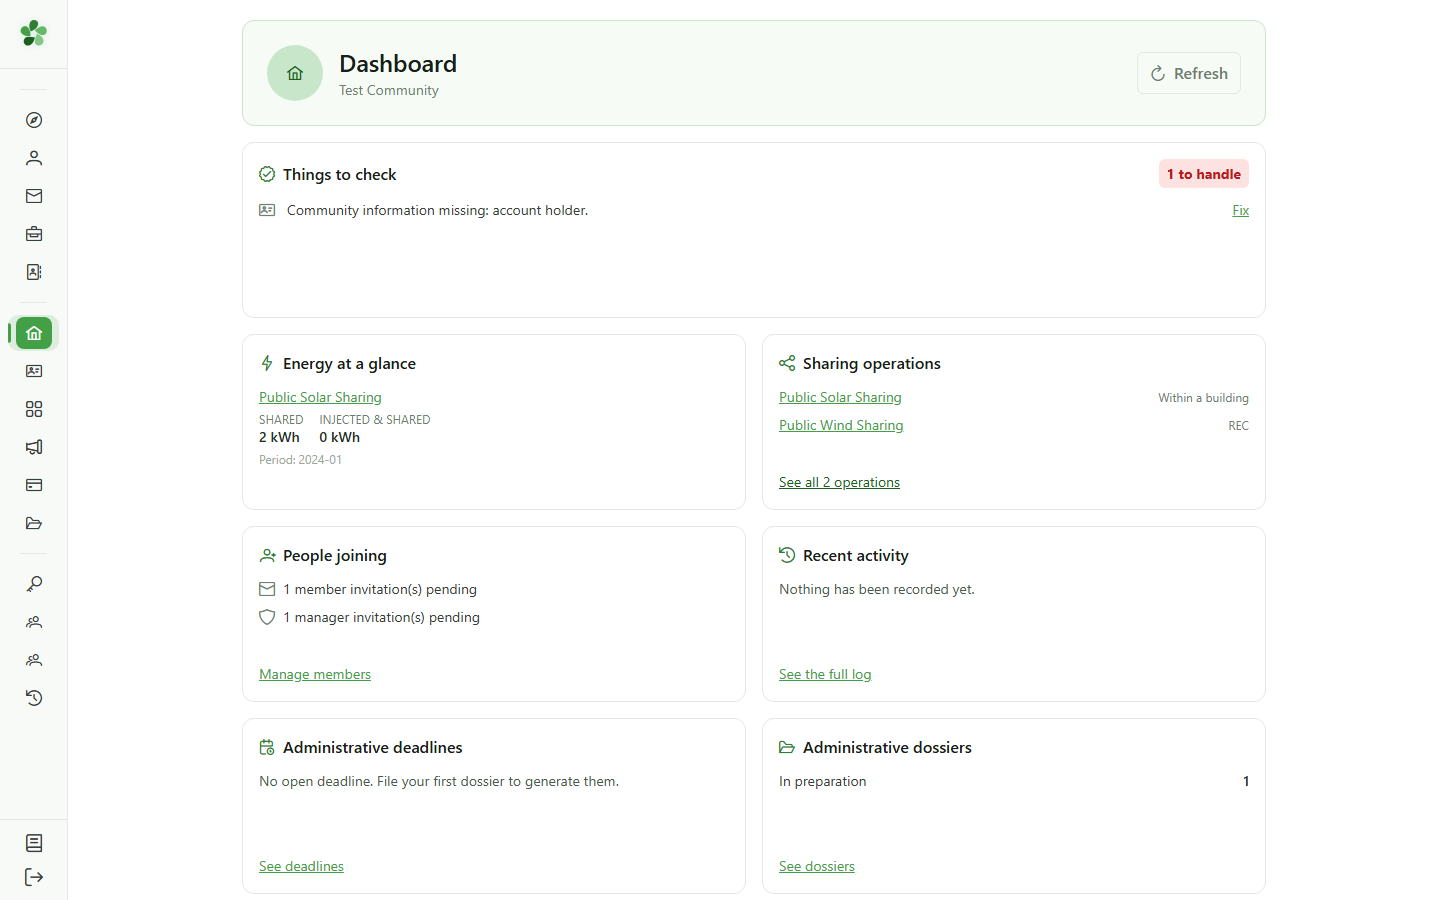
At the bottom of the dashboard, the "Available modules" strip shows what the community is not using yet. An administrator can enable them from here; a manager is told whom to ask.
11 Refresh
Dashboard
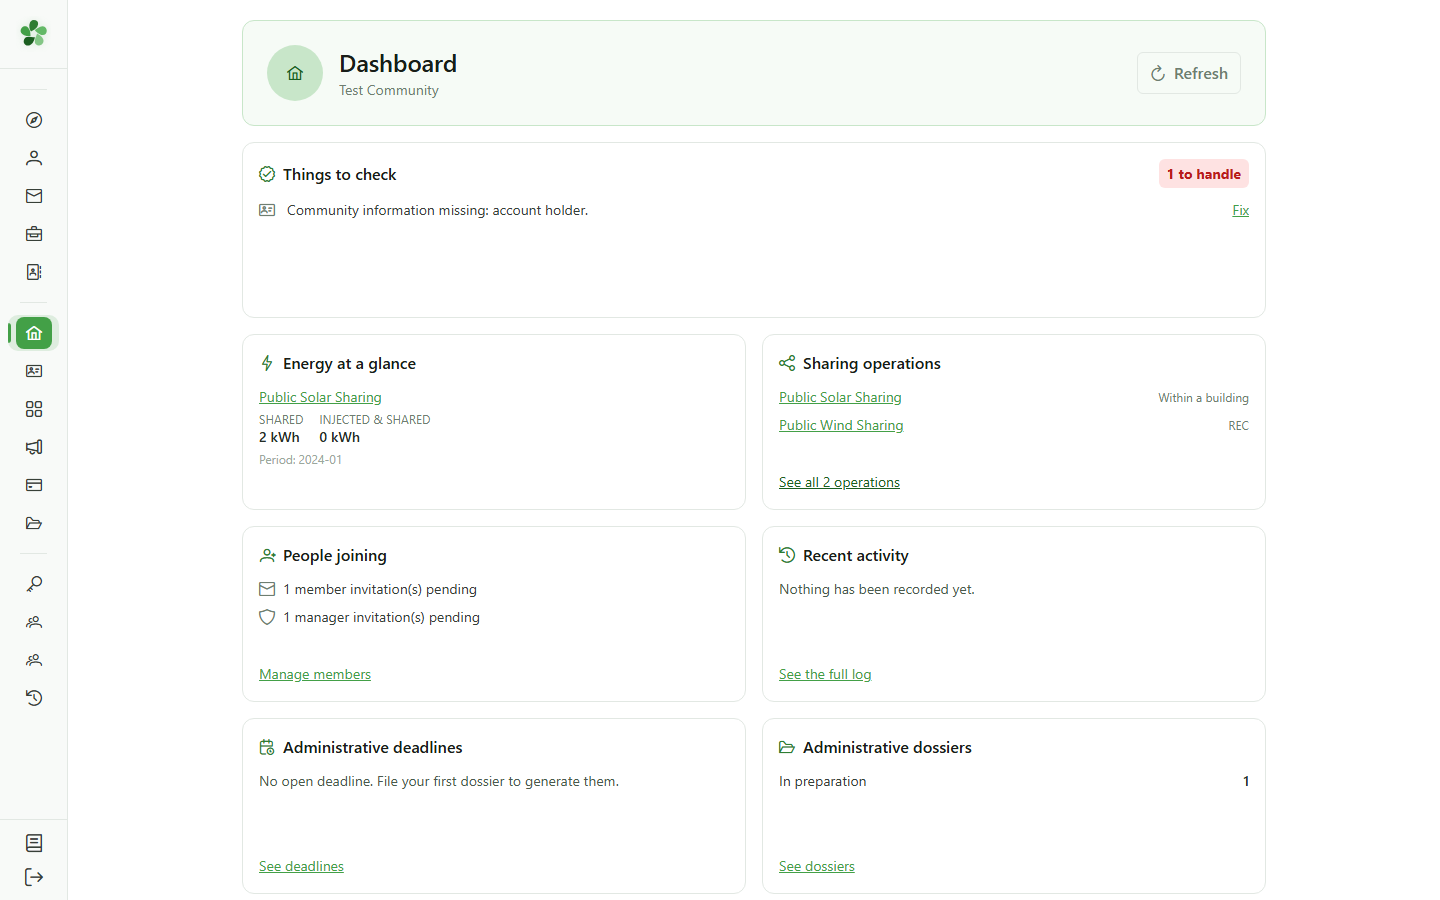
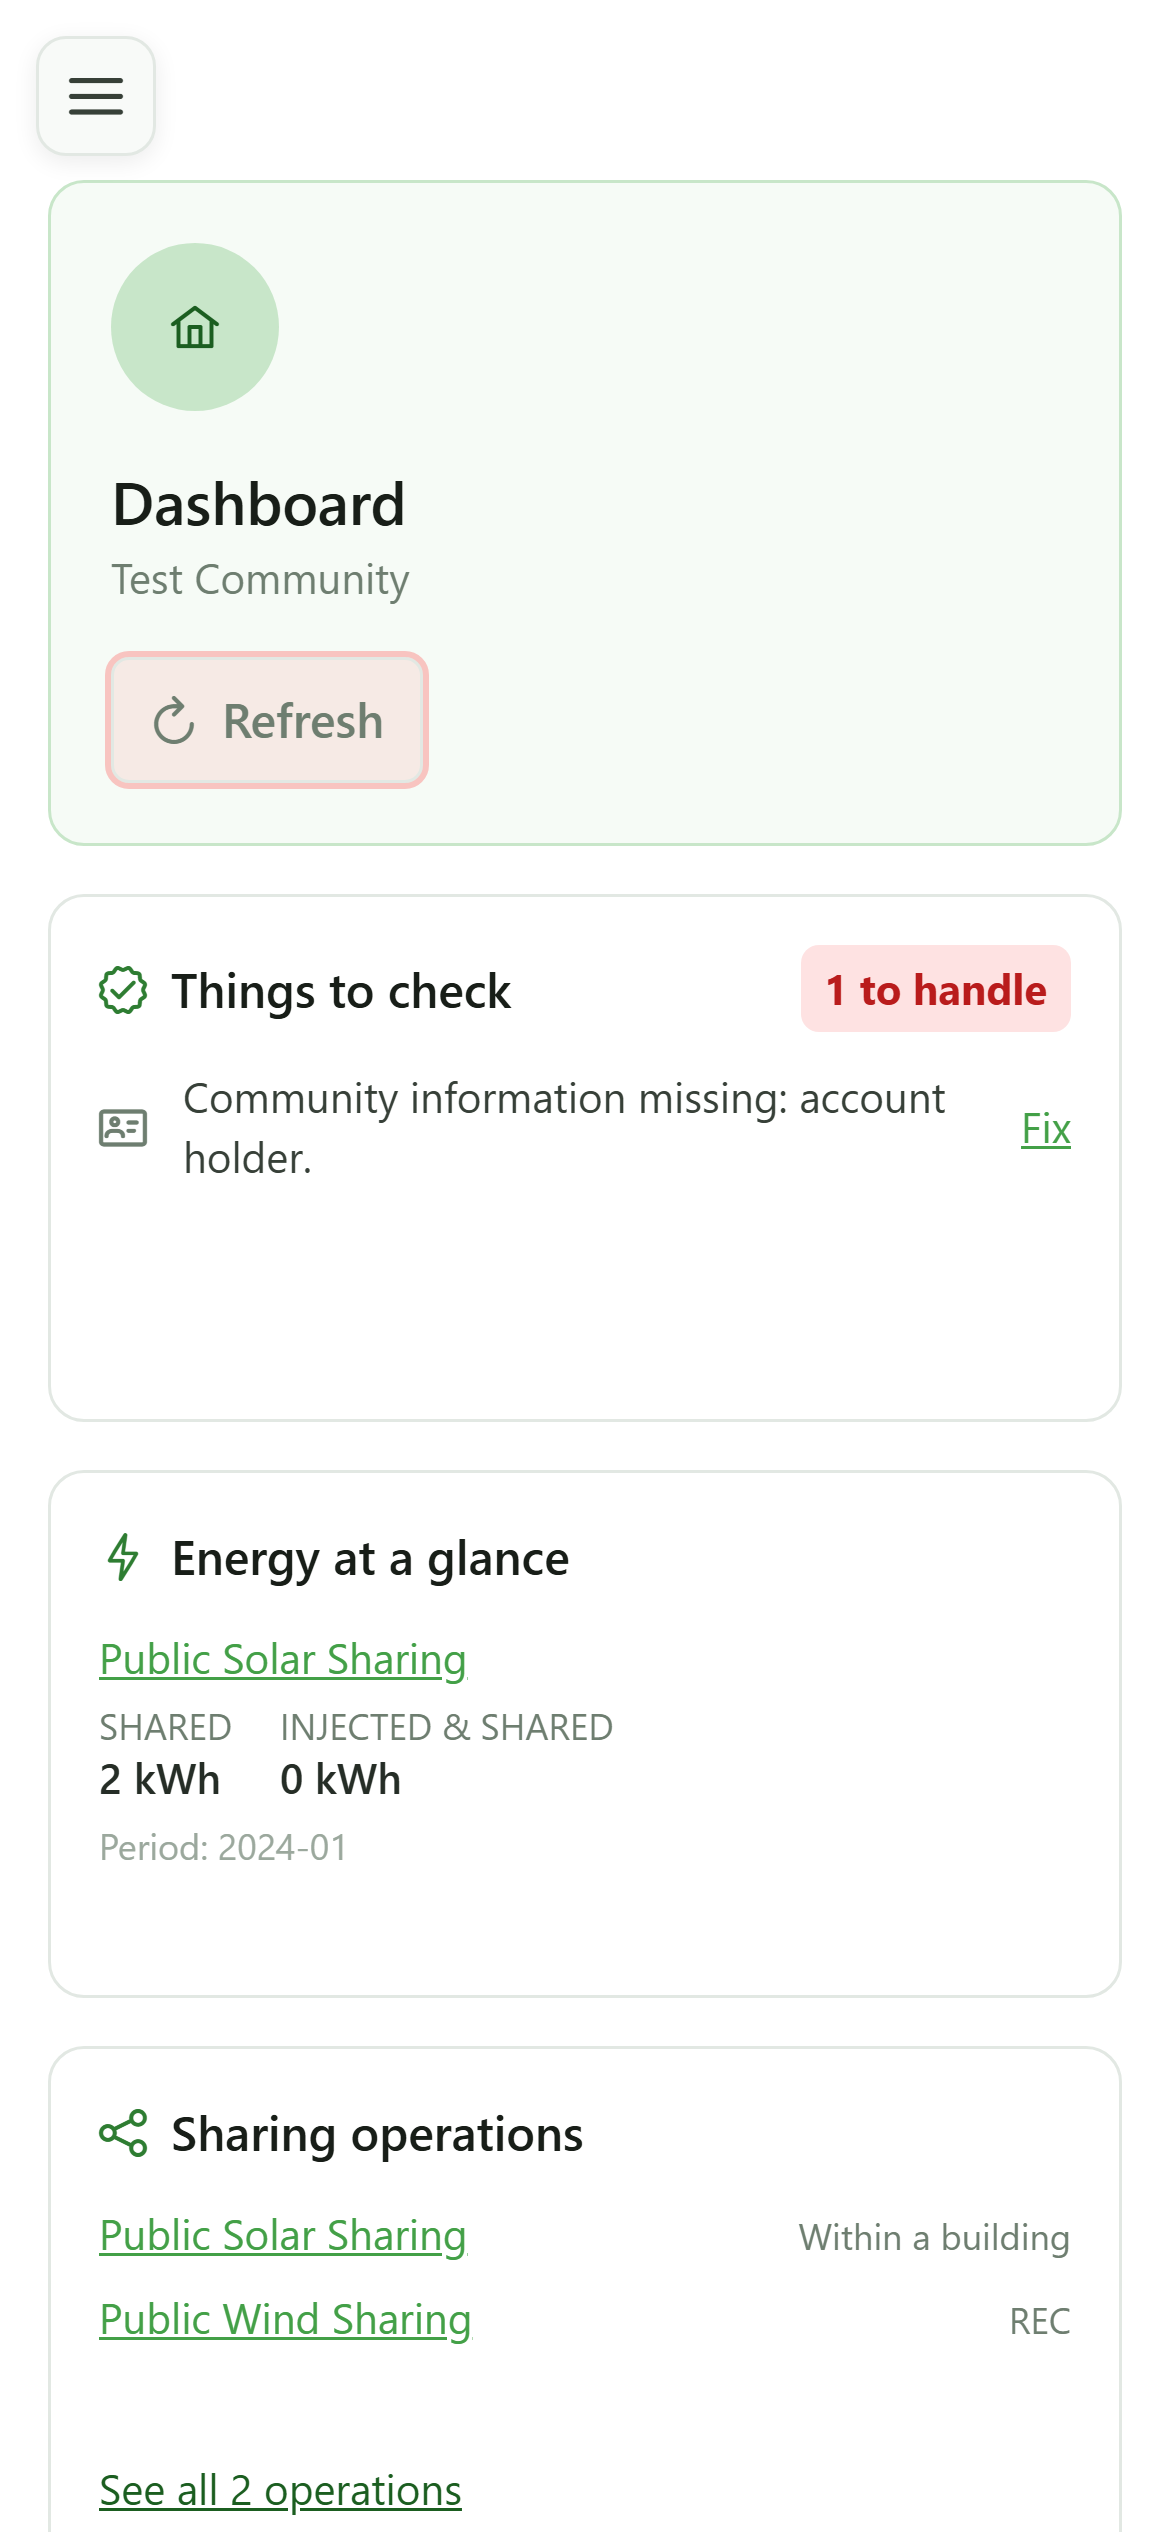
The "Refresh" button reloads every tile at once without reloading the page — handy right after fixing something on another screen.
12 Up-to-date data
Dashboard
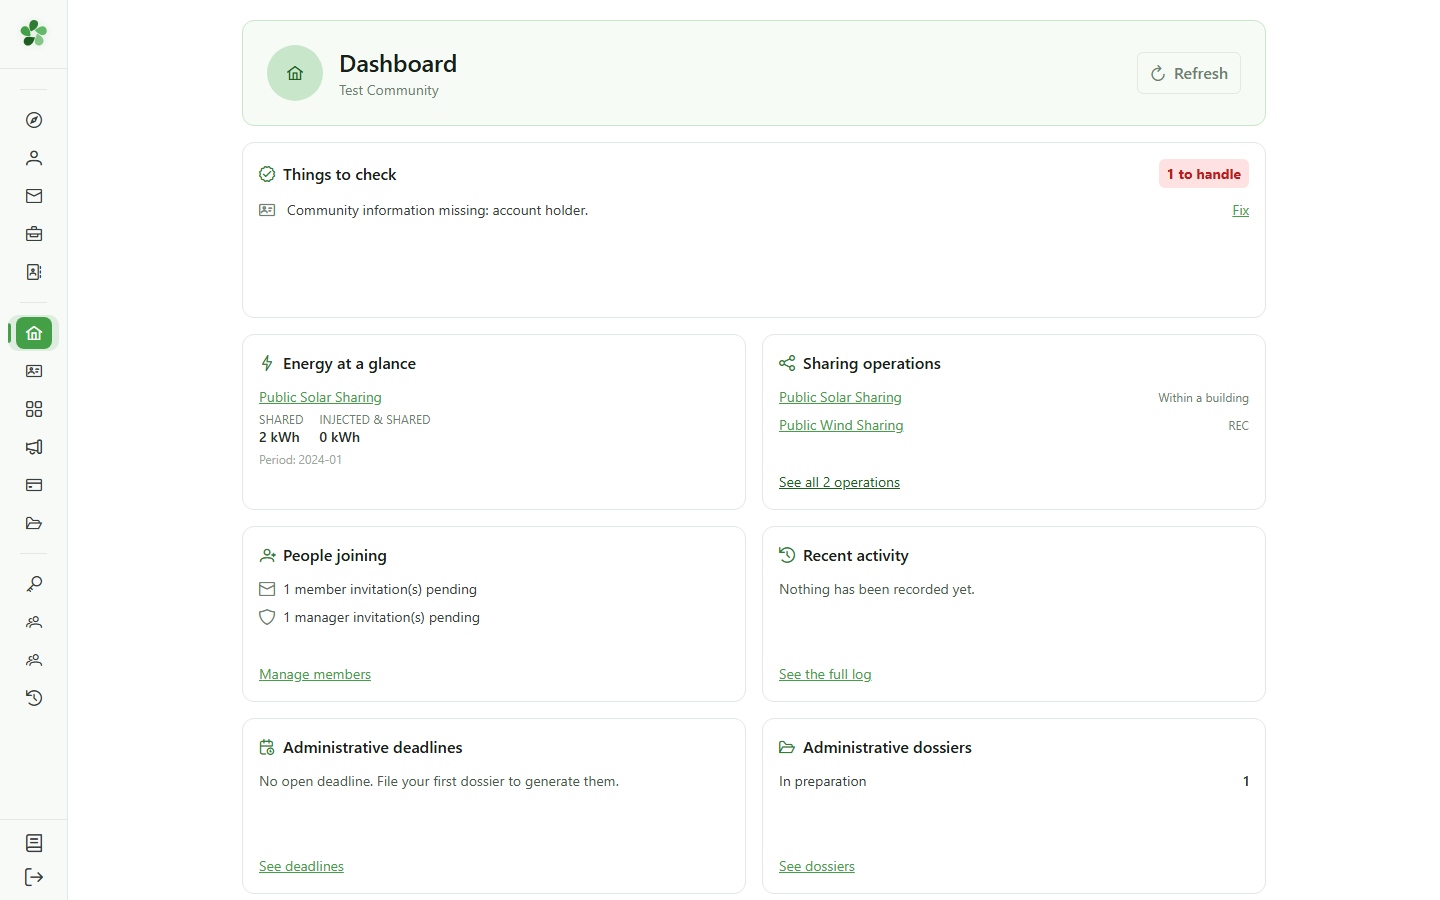
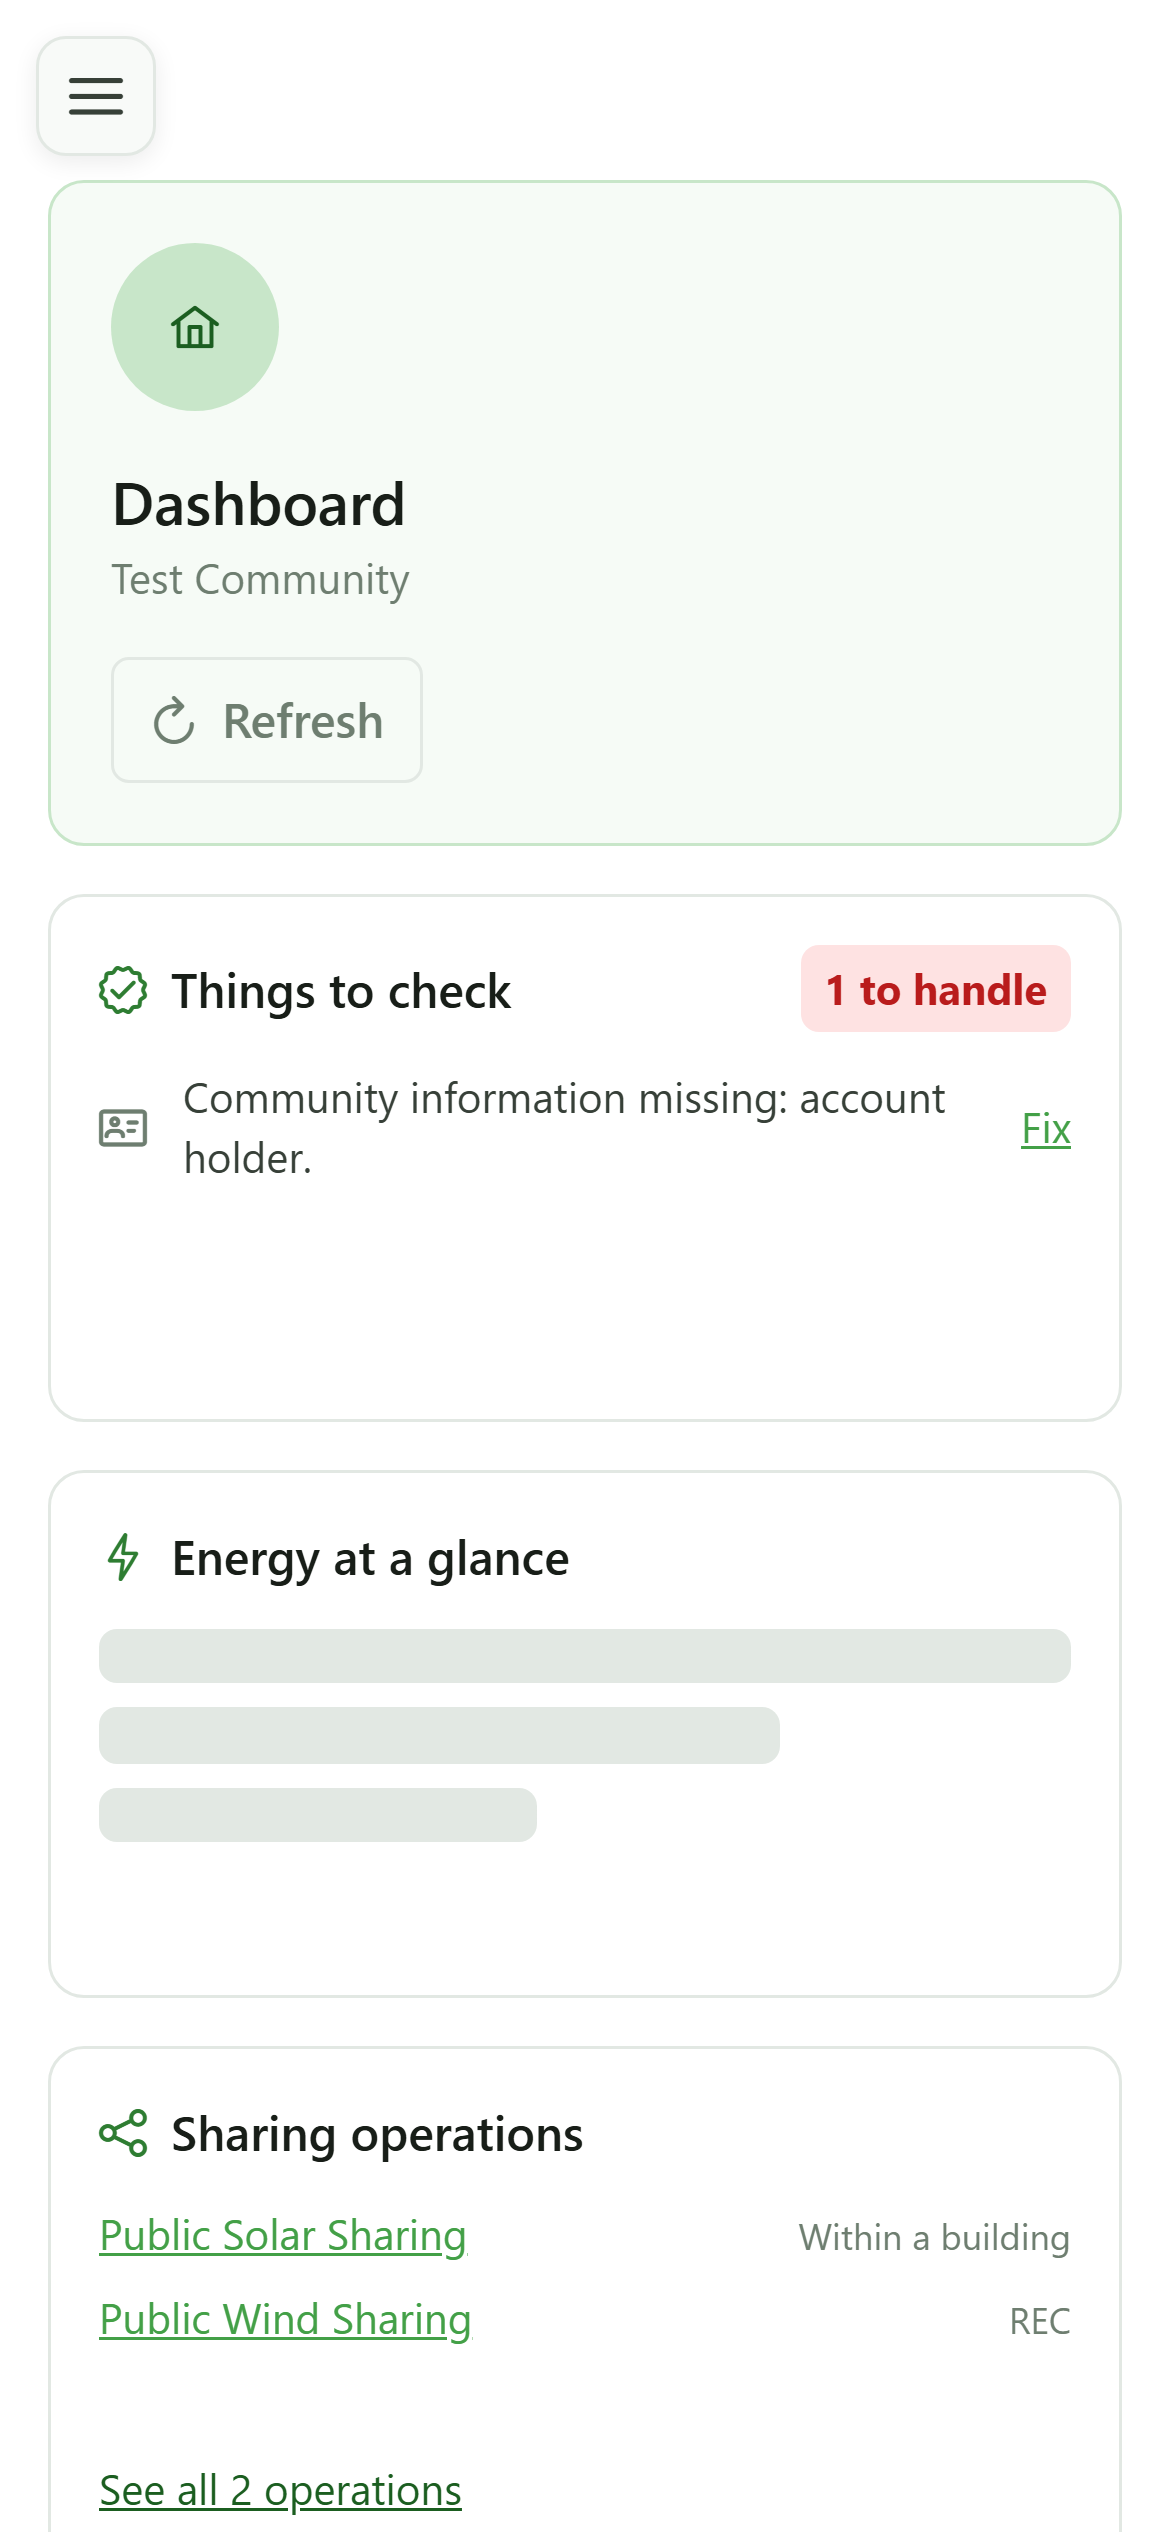
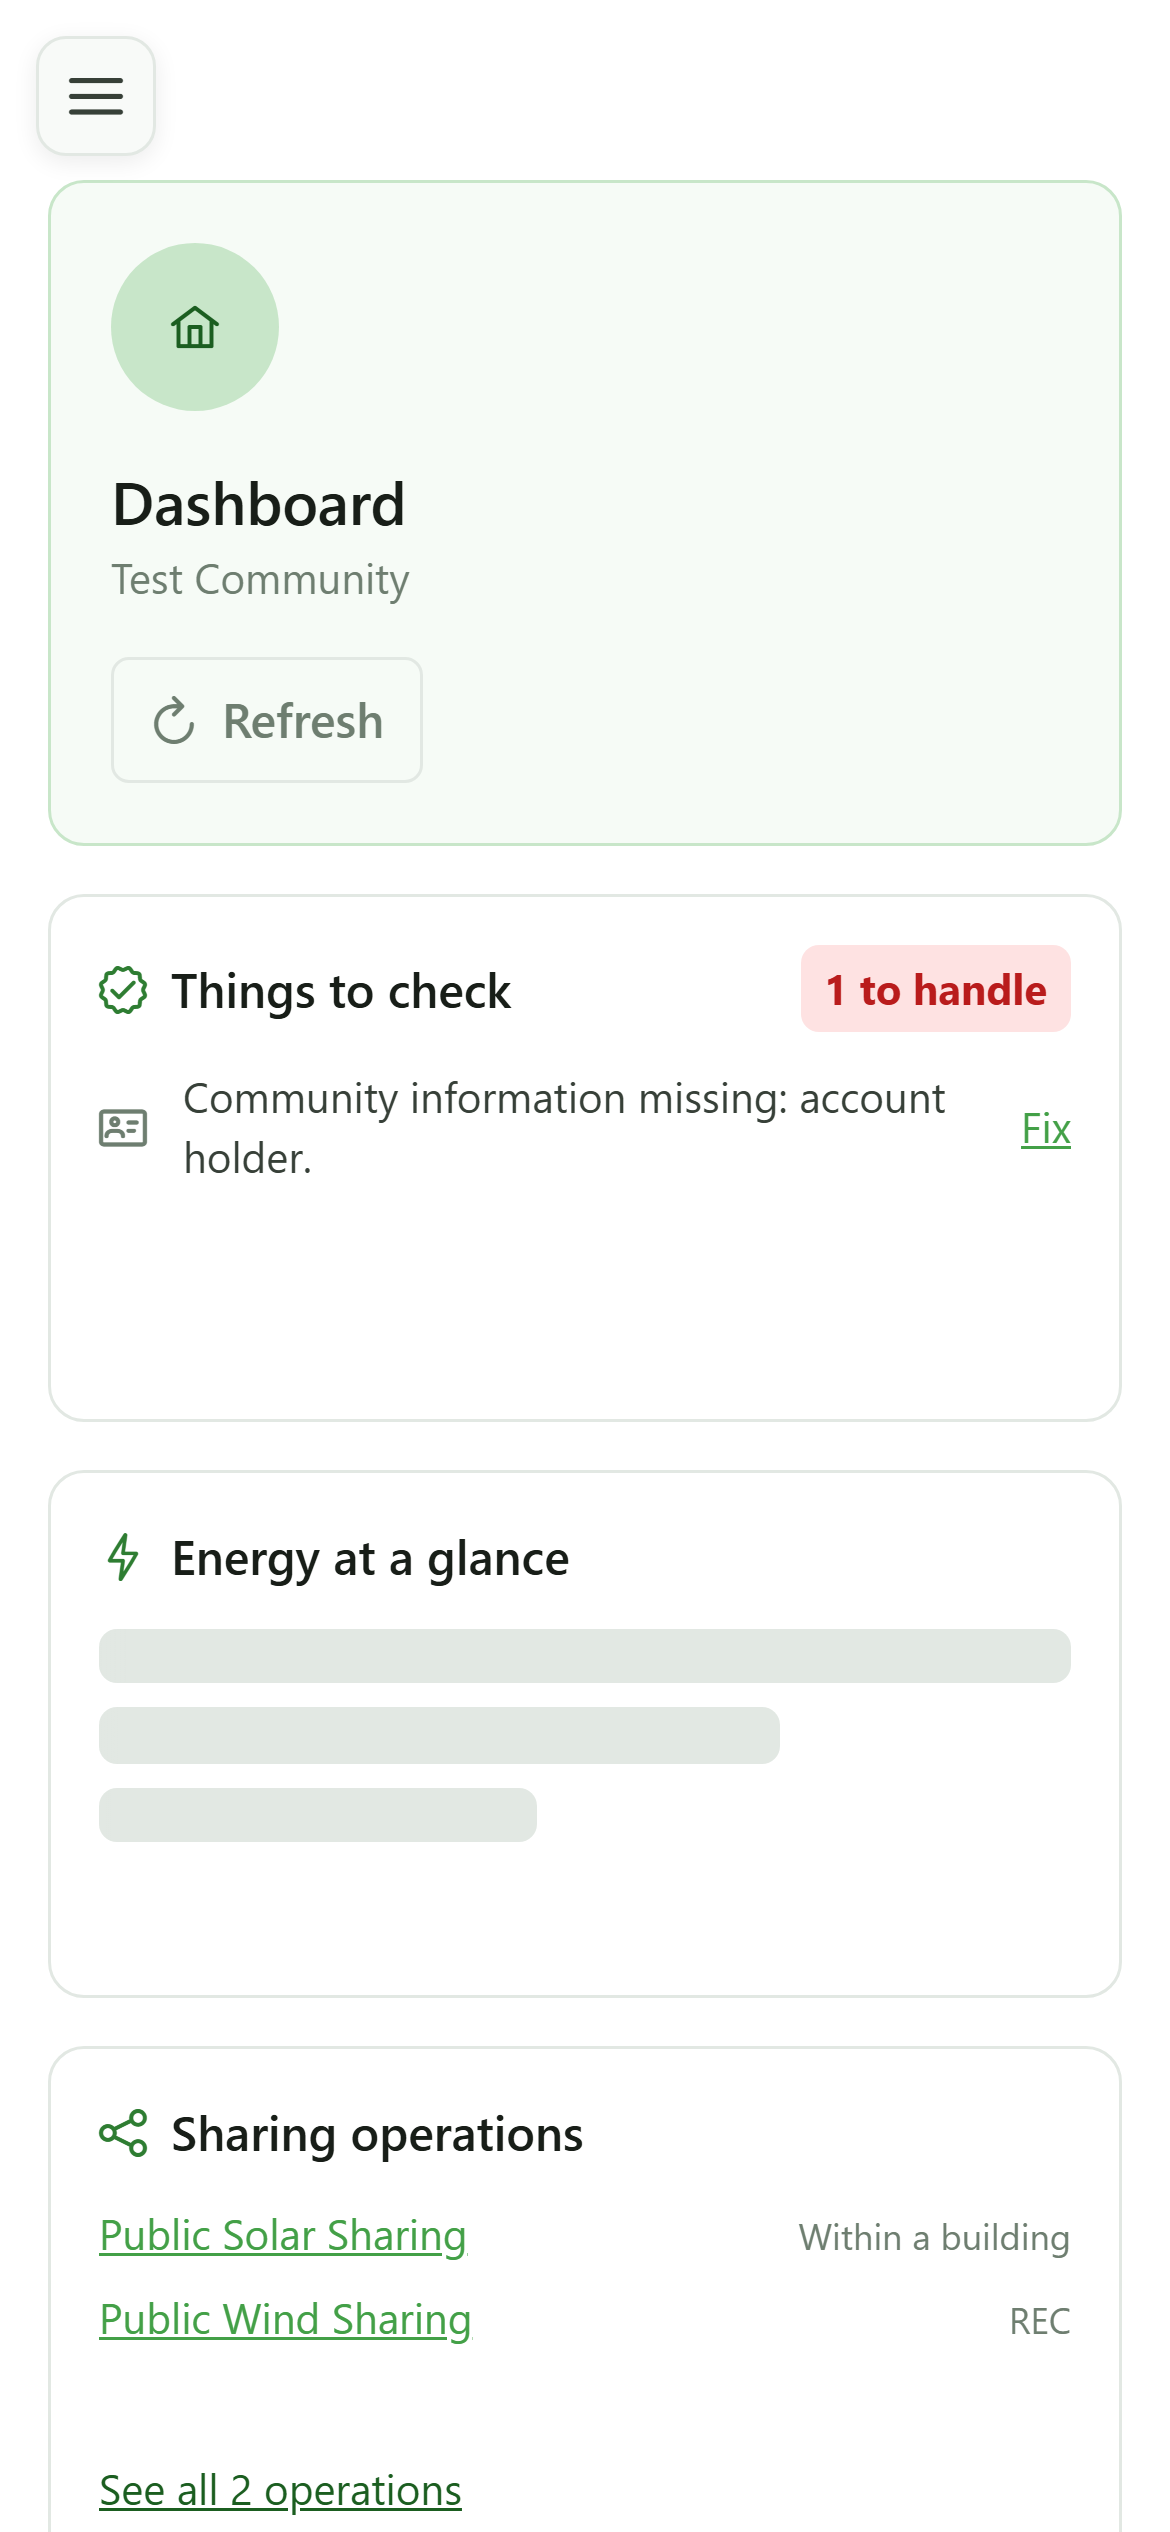
The tiles reload one by one and settle back into their usual display with the freshest data.
The manager dashboard
Guide utilisateur
User guide
1 Enter the community
Home page
From your home page, open the community you want to work on. It becomes your active community and you land on its dashboard.
2 The dashboard
Overview
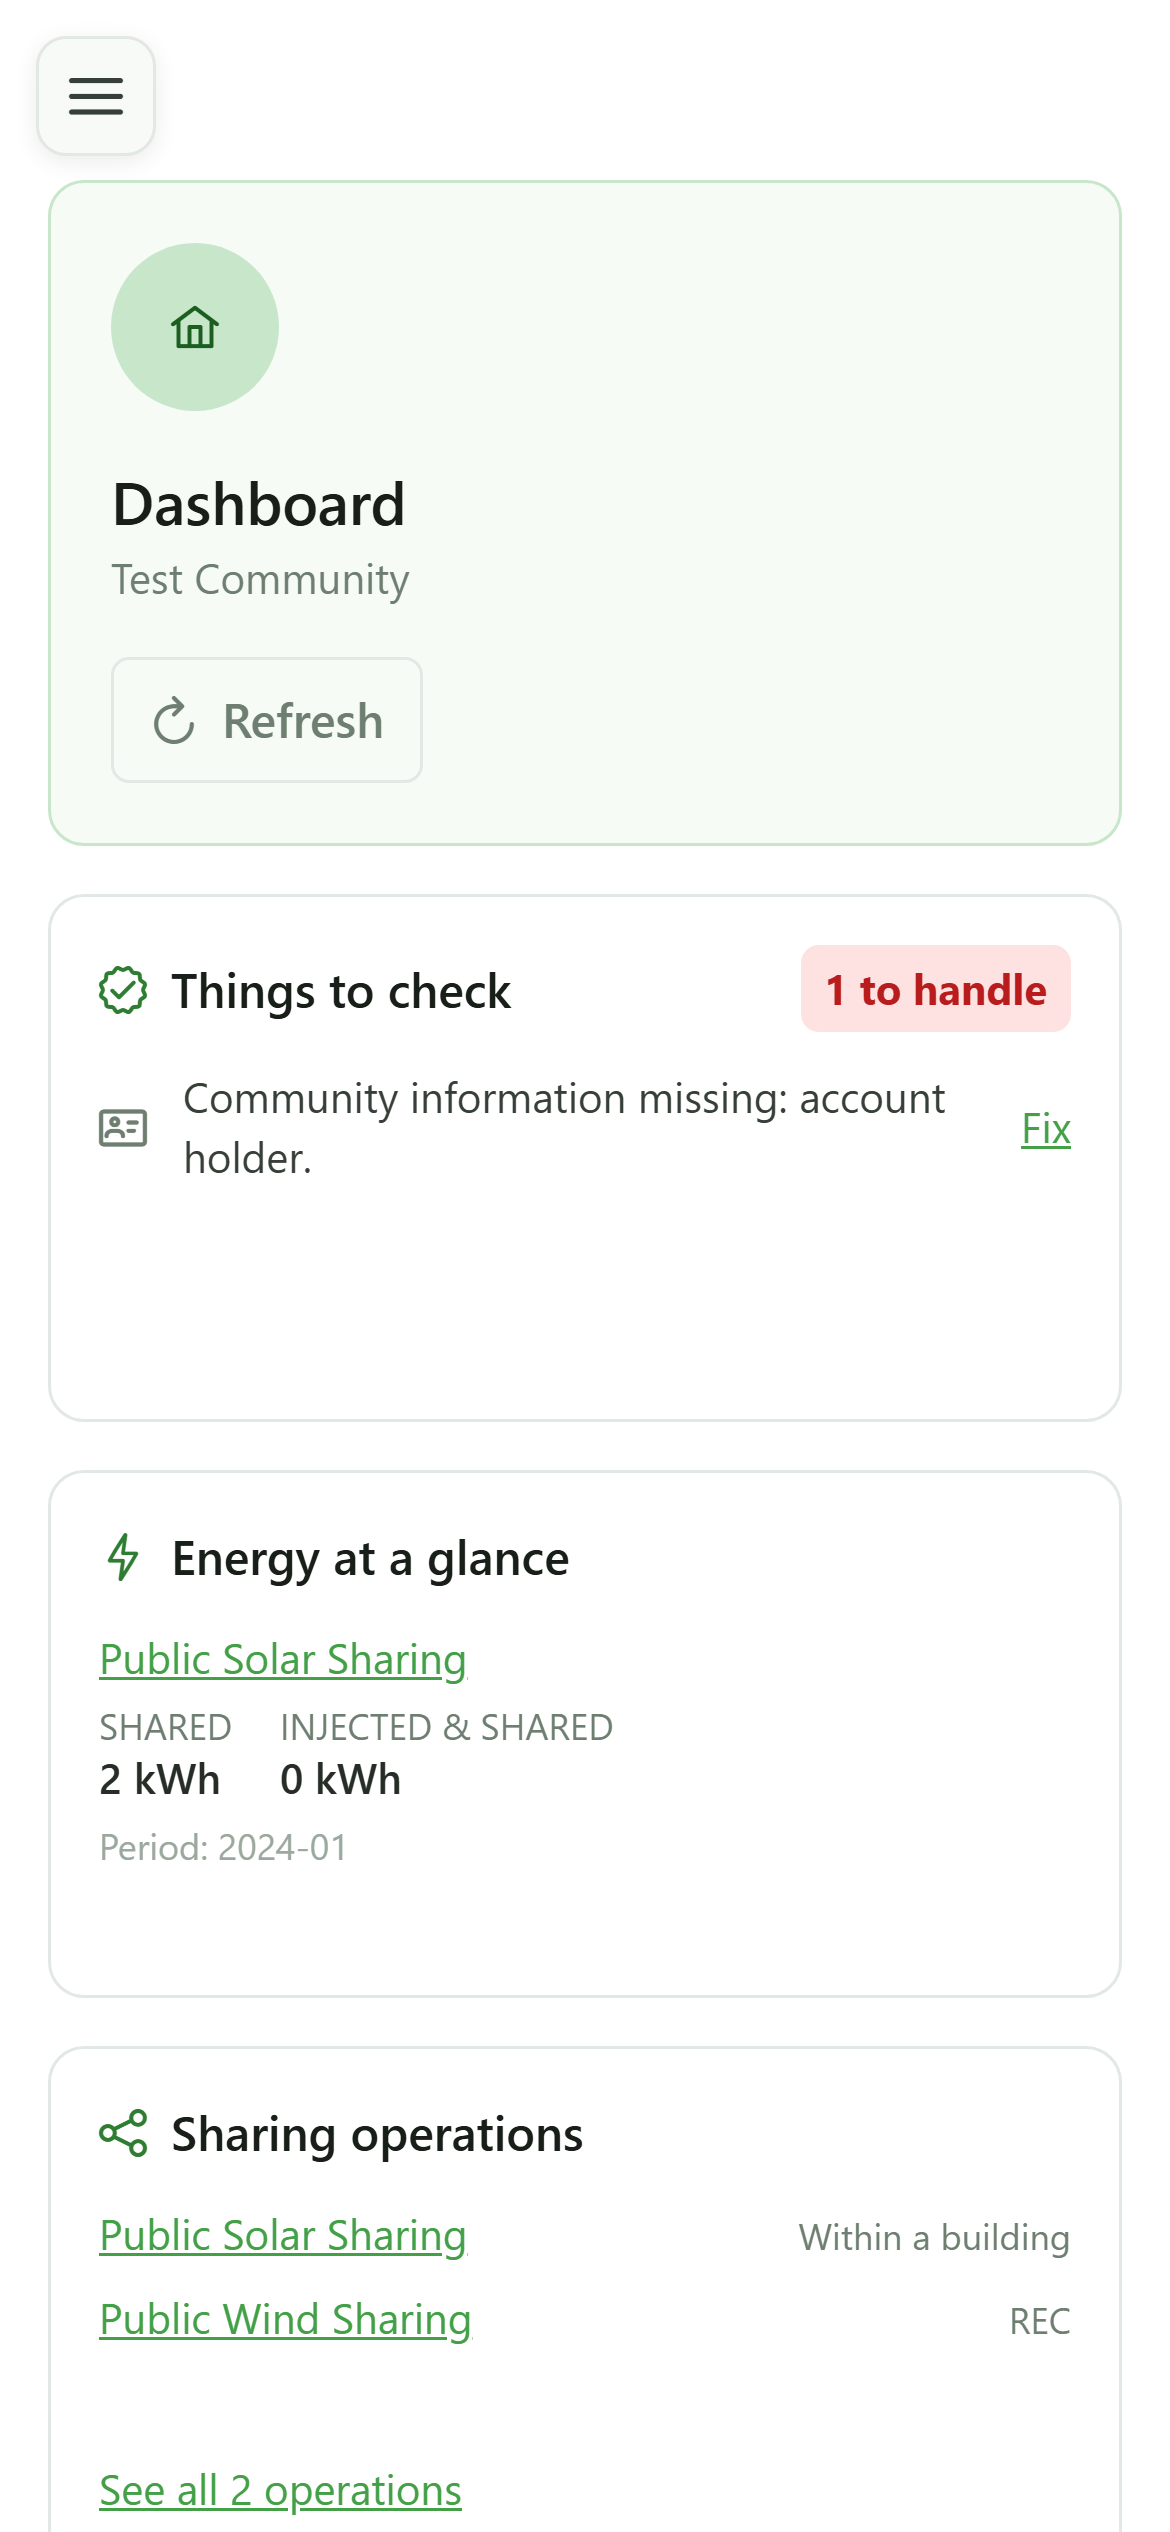
The dashboard sums up the state of the active community: what needs your attention, the shared energy, the operations, and the modules the community is subscribed to.
3 Things to check
Dashboard
The first tile gathers what is blocking, or about to: missing legal details, meters waiting on the grid operator, operations without an allocation key. Every row links straight to the screen where you fix it.
4 Fix it in one click
Things to check
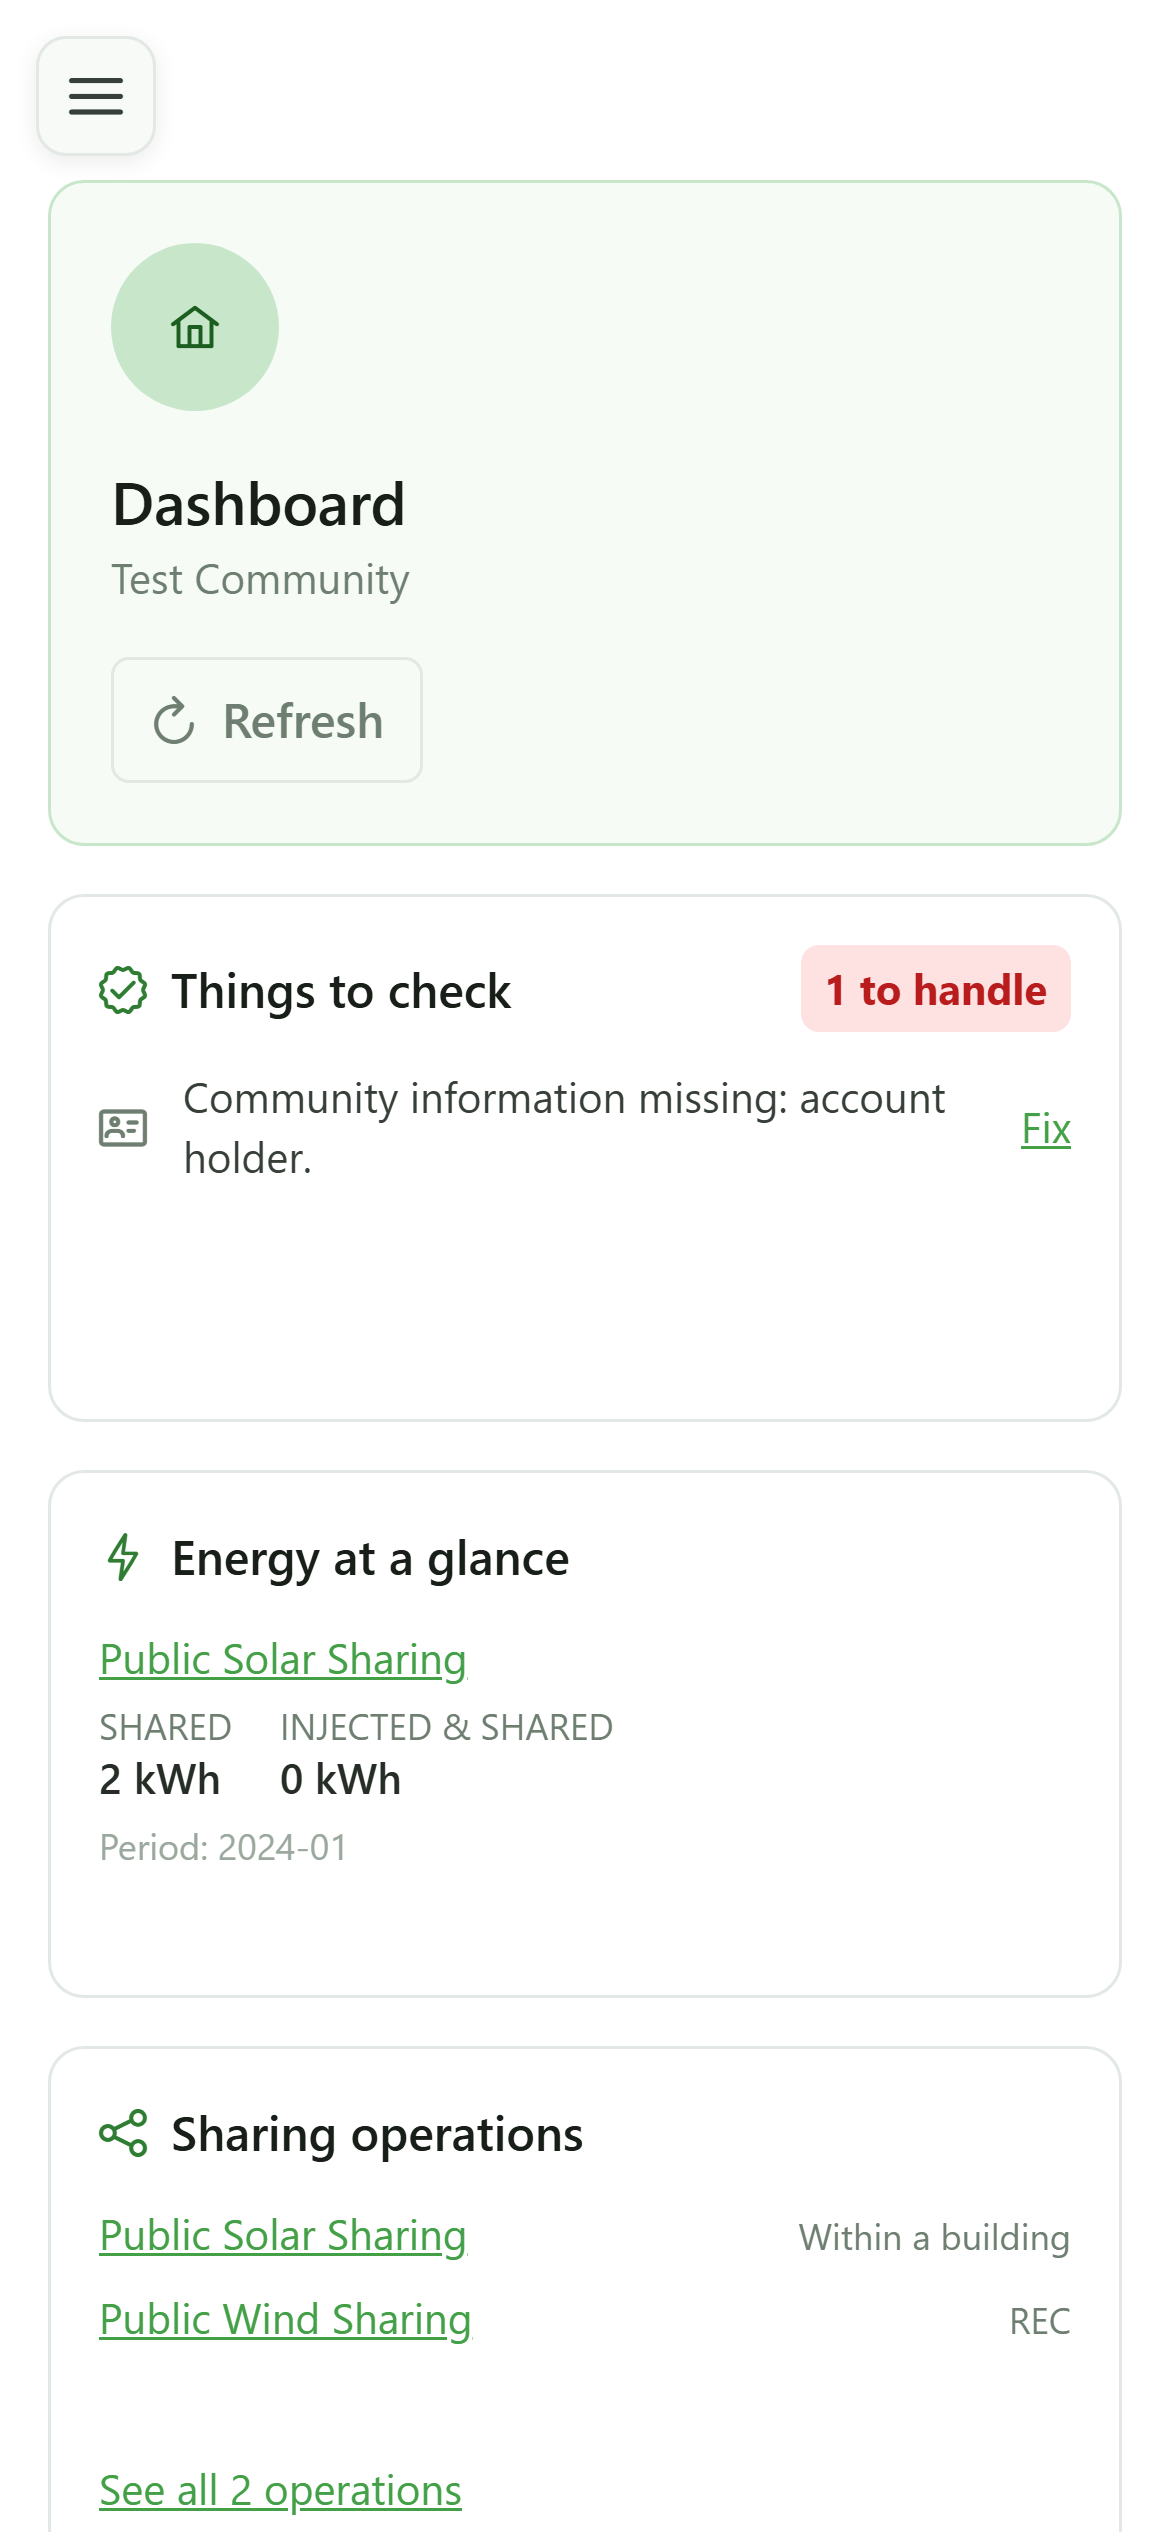
Click "Fix": you land on the page in question — here, the community information.
5 Energy at a glance
Dashboard
For each sharing operation, the tile shows the shared and injected energy over the latest period with data. The operation name links to its page.
6 Sharing operations
Dashboard
The tile lists the community's operations with their type. The link at the bottom opens the full list.
7 See every operation
Sharing operations
The link takes you to the full sharing-operation management screen.
8 Arrivals and recent activity
Dashboard
"People joining" counts the invitations sent and the records still to be filled in. "Recent activity" shows the latest actions recorded in the community's audit log.
9 The enabled modules
Dashboard
Billing, news, dossiers and administrative deadlines only appear when the community is subscribed to the matching module. A community with no subscription simply does not see these tiles.
10 Available modules
Dashboard
At the bottom of the dashboard, the "Available modules" strip shows what the community is not using yet. An administrator can enable them from here; a manager is told whom to ask.
11 Refresh
Dashboard
The "Refresh" button reloads every tile at once without reloading the page — handy right after fixing something on another screen.
12 Up-to-date data
Dashboard
The tiles reload one by one and settle back into their usual display with the freshest data.