Follow sharing within an operation
Guide utilisateur
User guide
Gebruikershandleiding
Benutzerhandbuch
1 Sharing within the operations
Dashboard
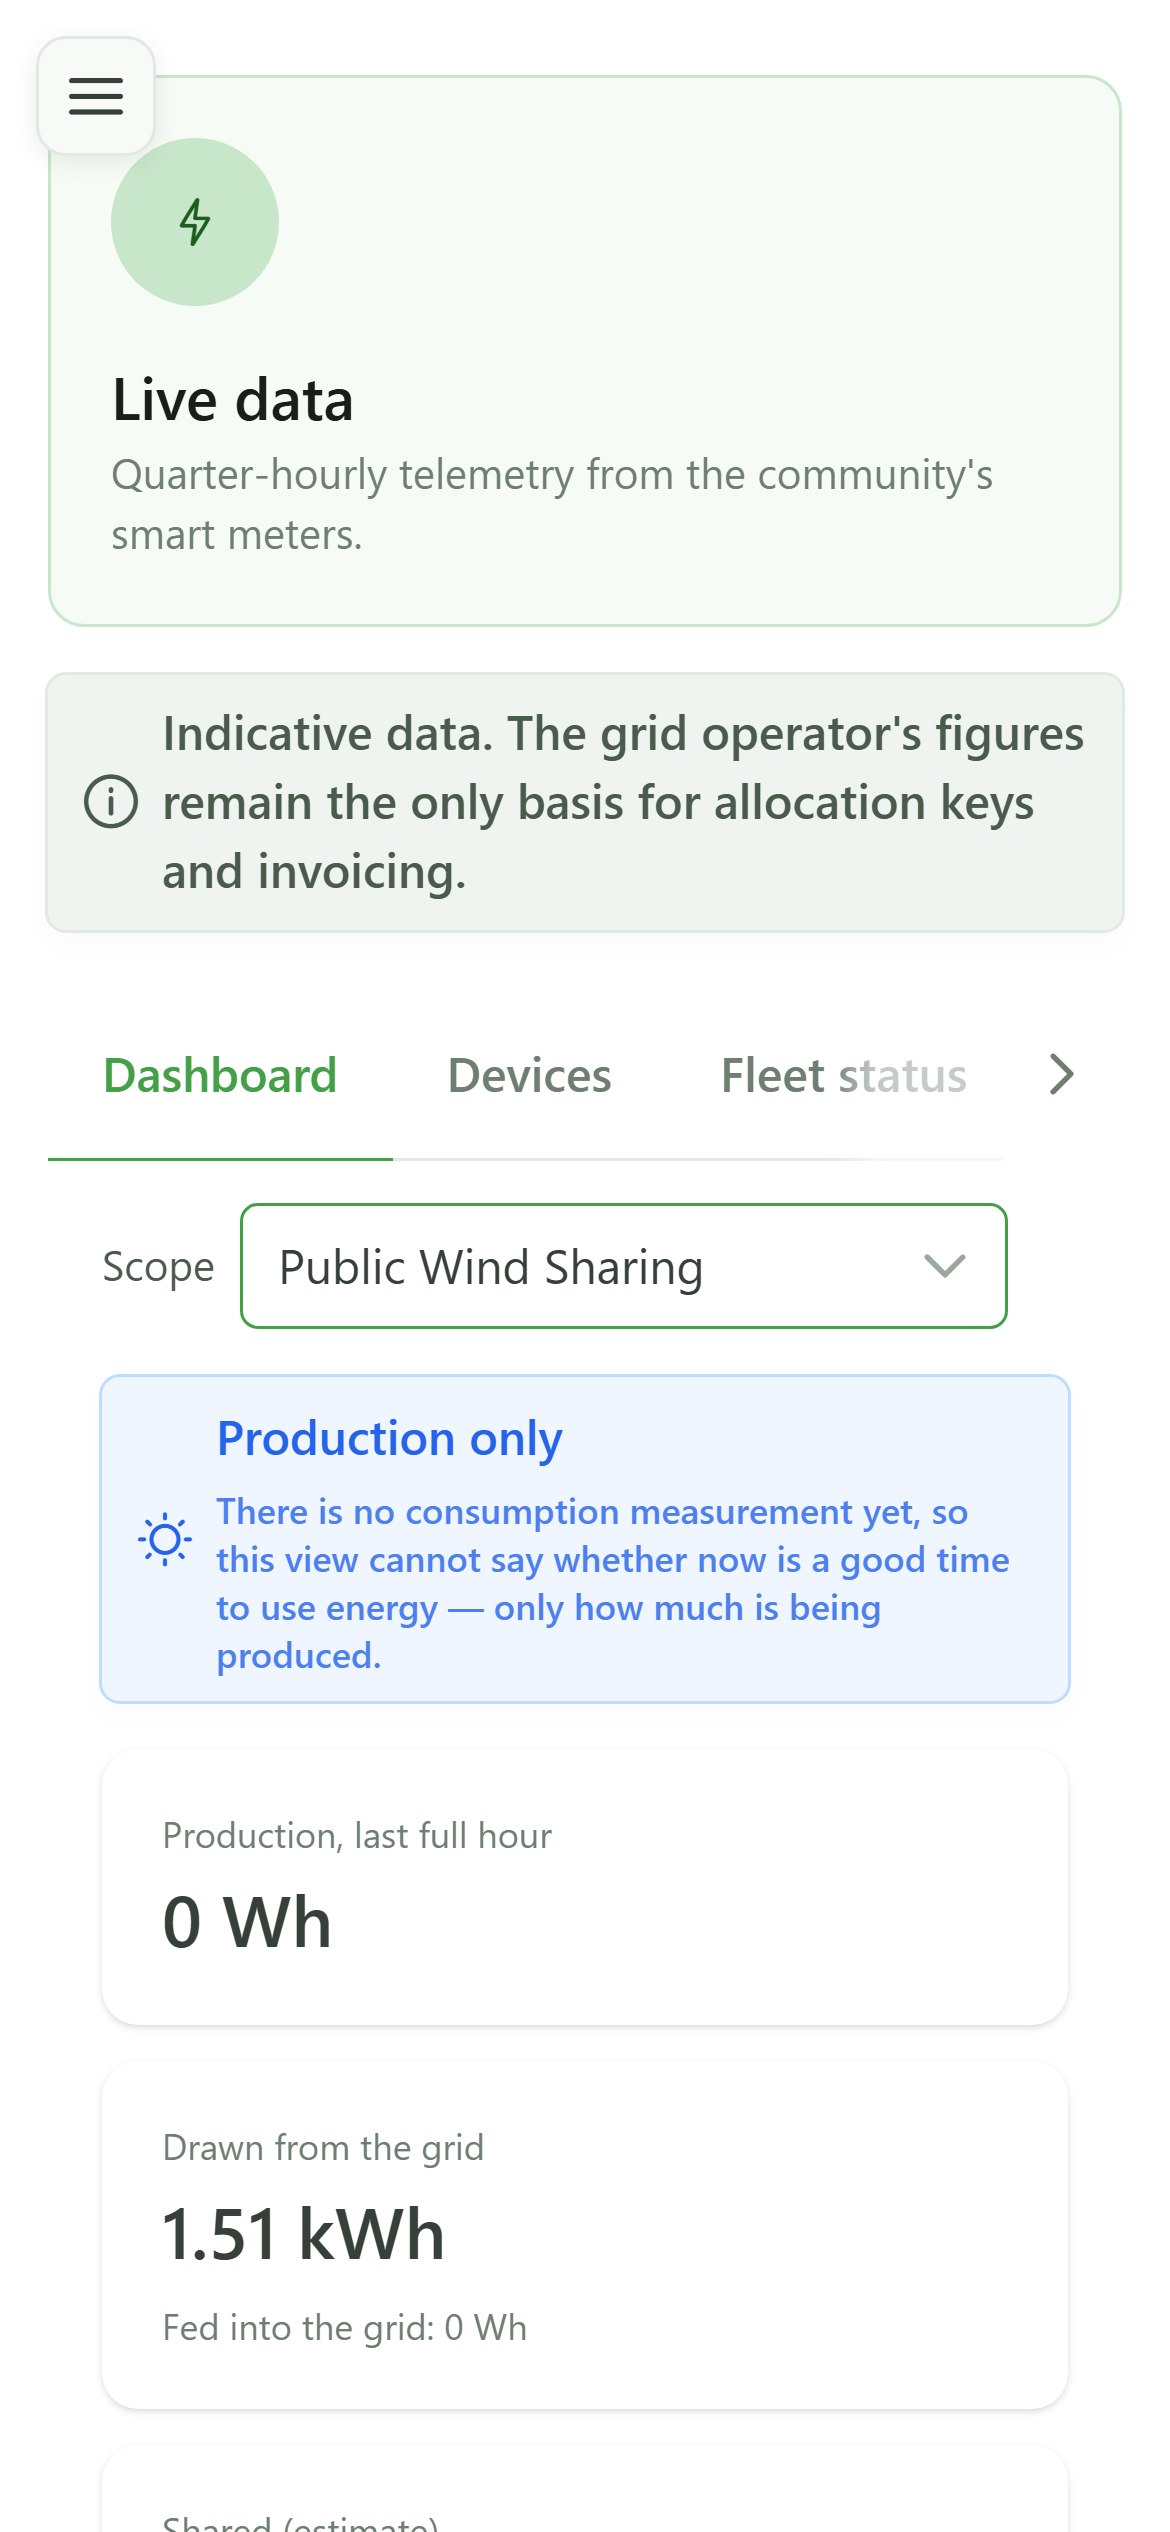
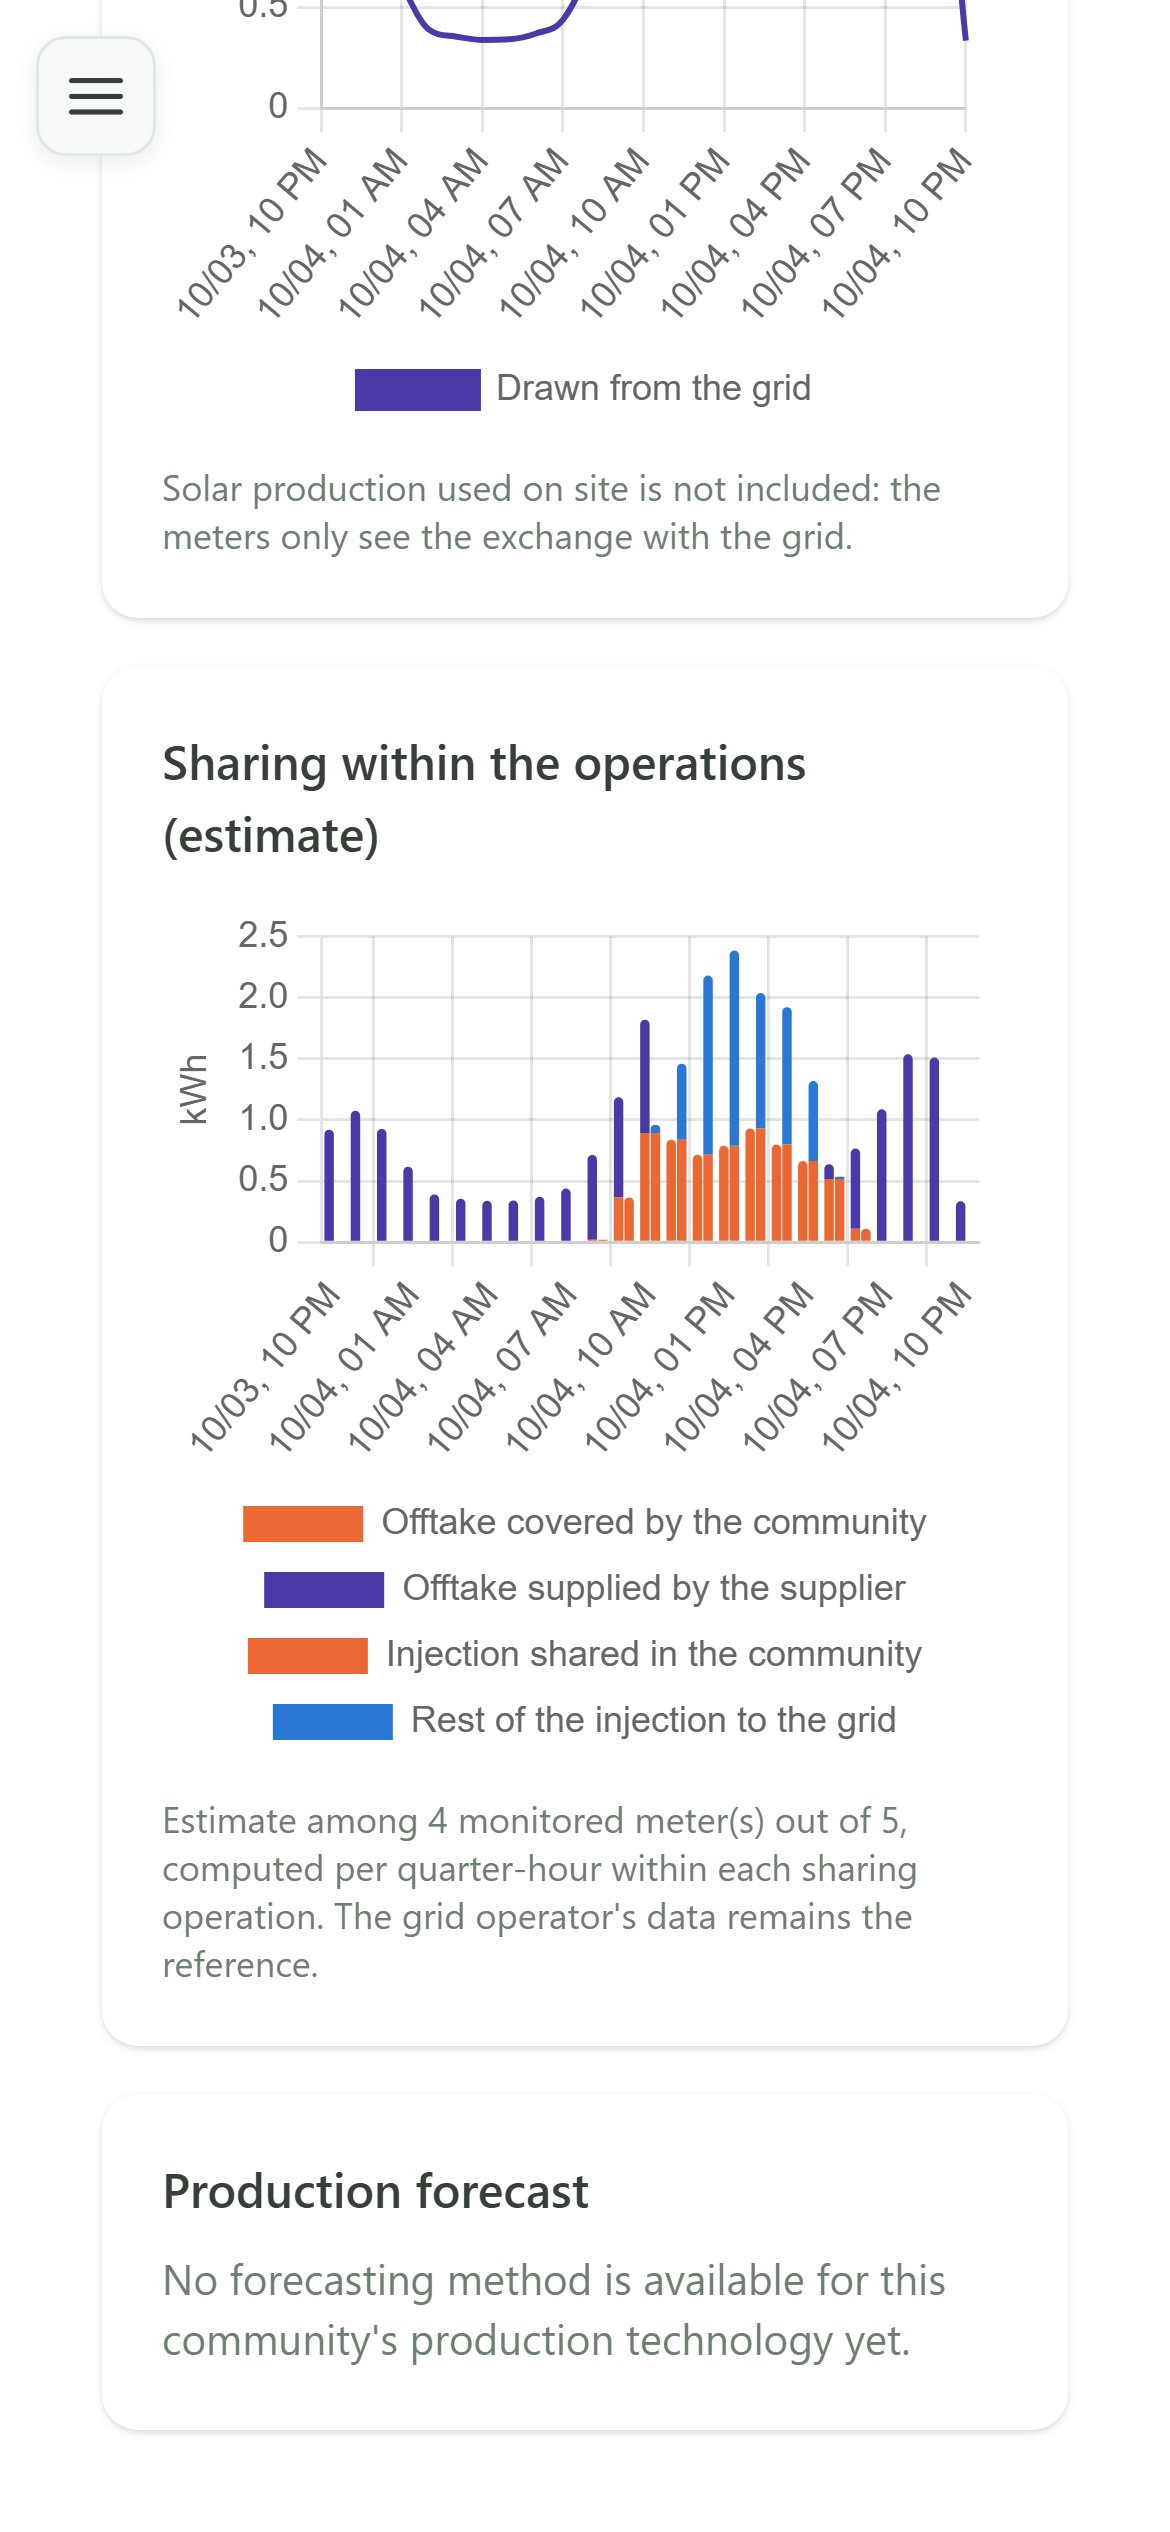
As soon as monitored meters belong to a sharing operation, the dashboard estimates, quarter-hour by quarter-hour, how much of the consumption the operation's production covered and how much of the injection was shared. It is an estimate among the monitored meters: the grid operator's data remains the reference.
2 Consumption drawn from the grid
Dashboard
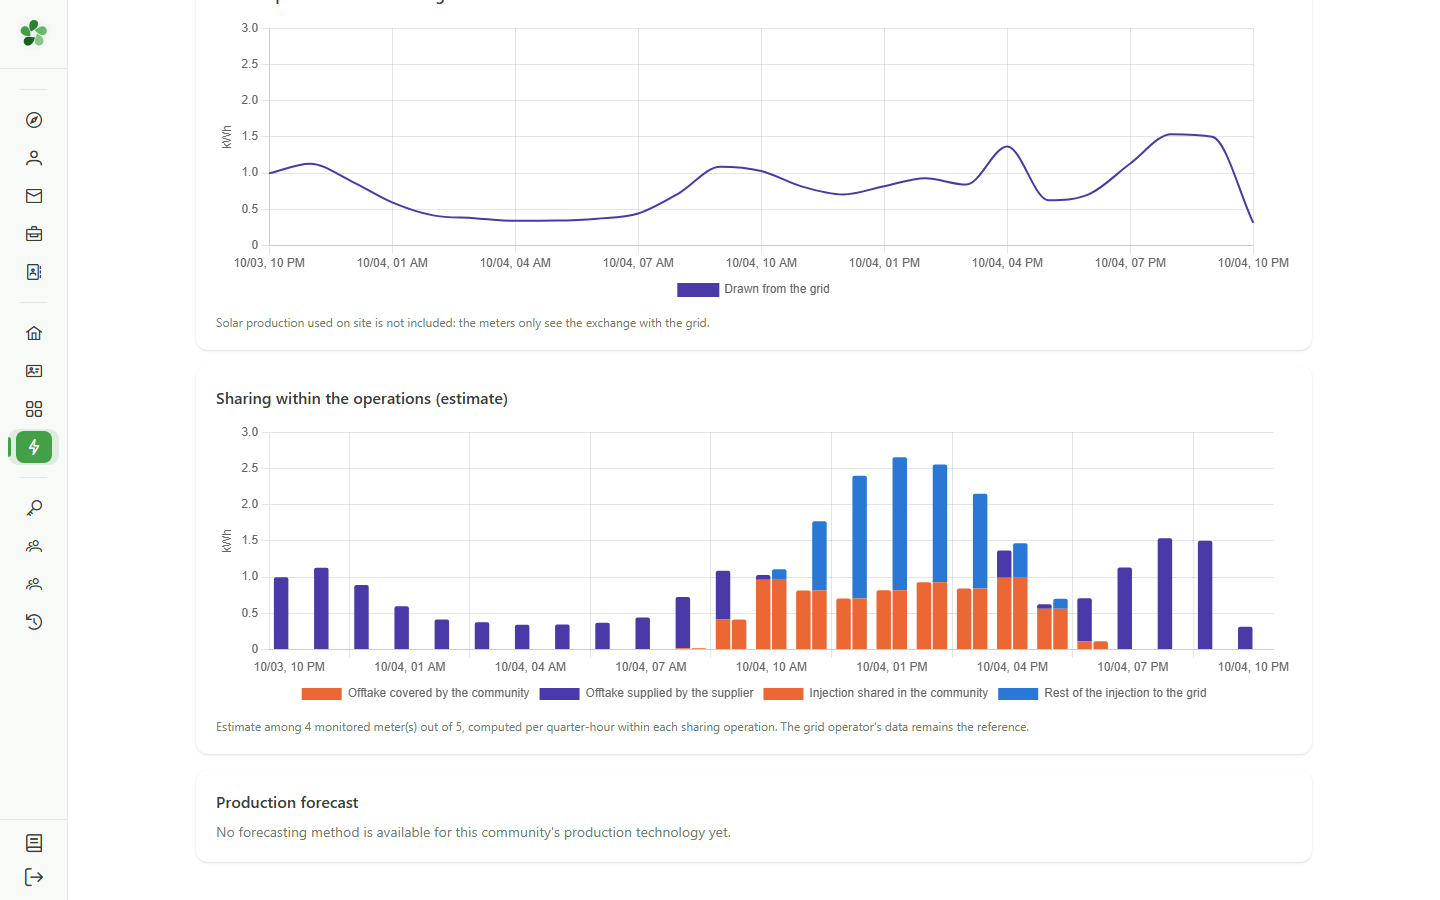
This chart shows the energy the monitored meters drew from the grid. Solar production used on site is not included: the meters only see the exchange with the grid. It stays hidden while too few members contribute.
3 Choose a sharing operation
Scope
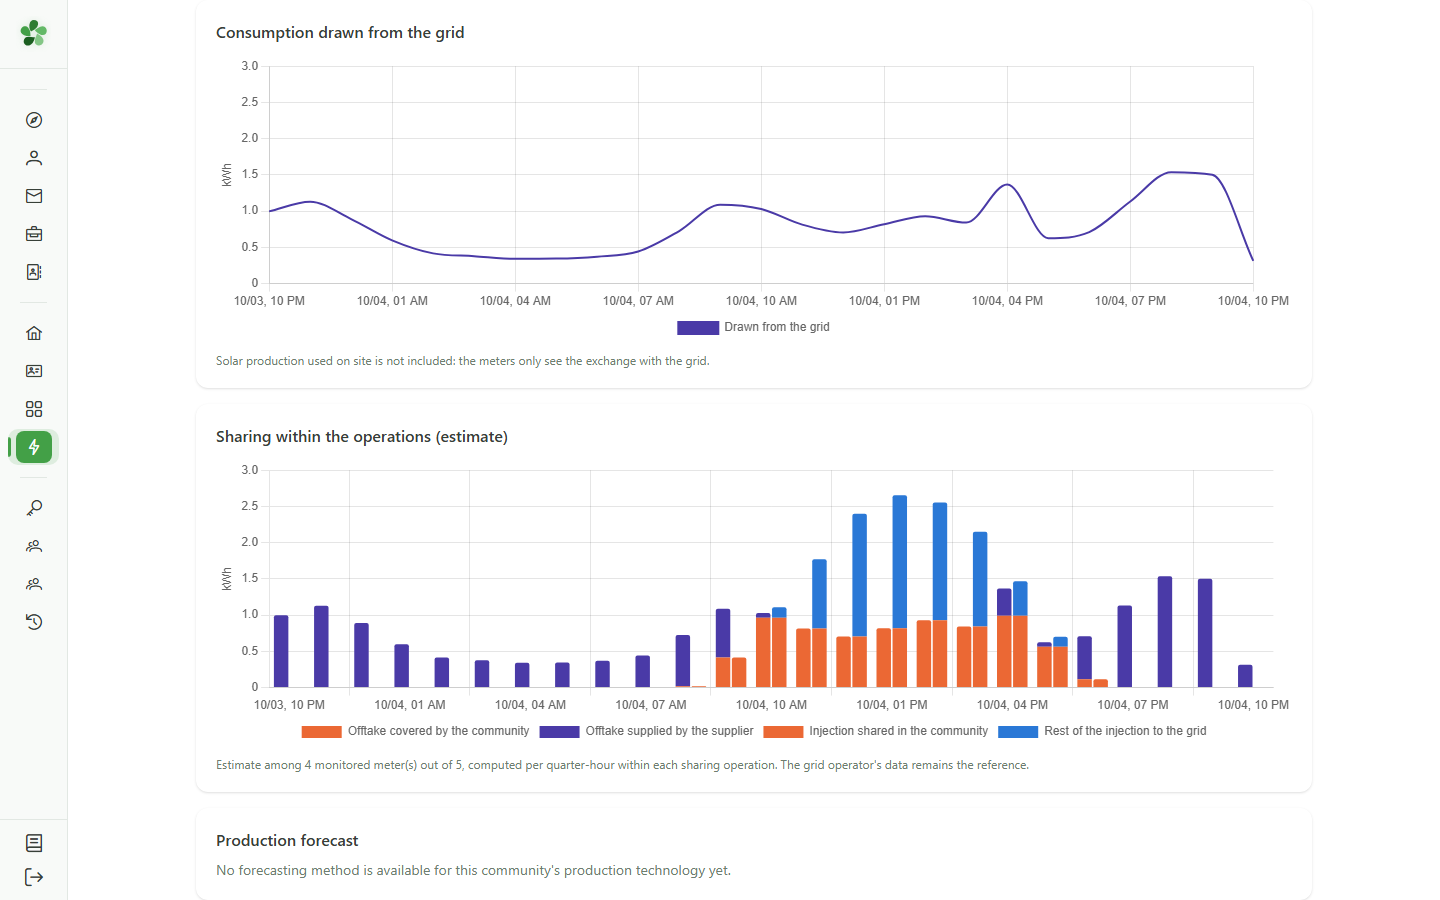
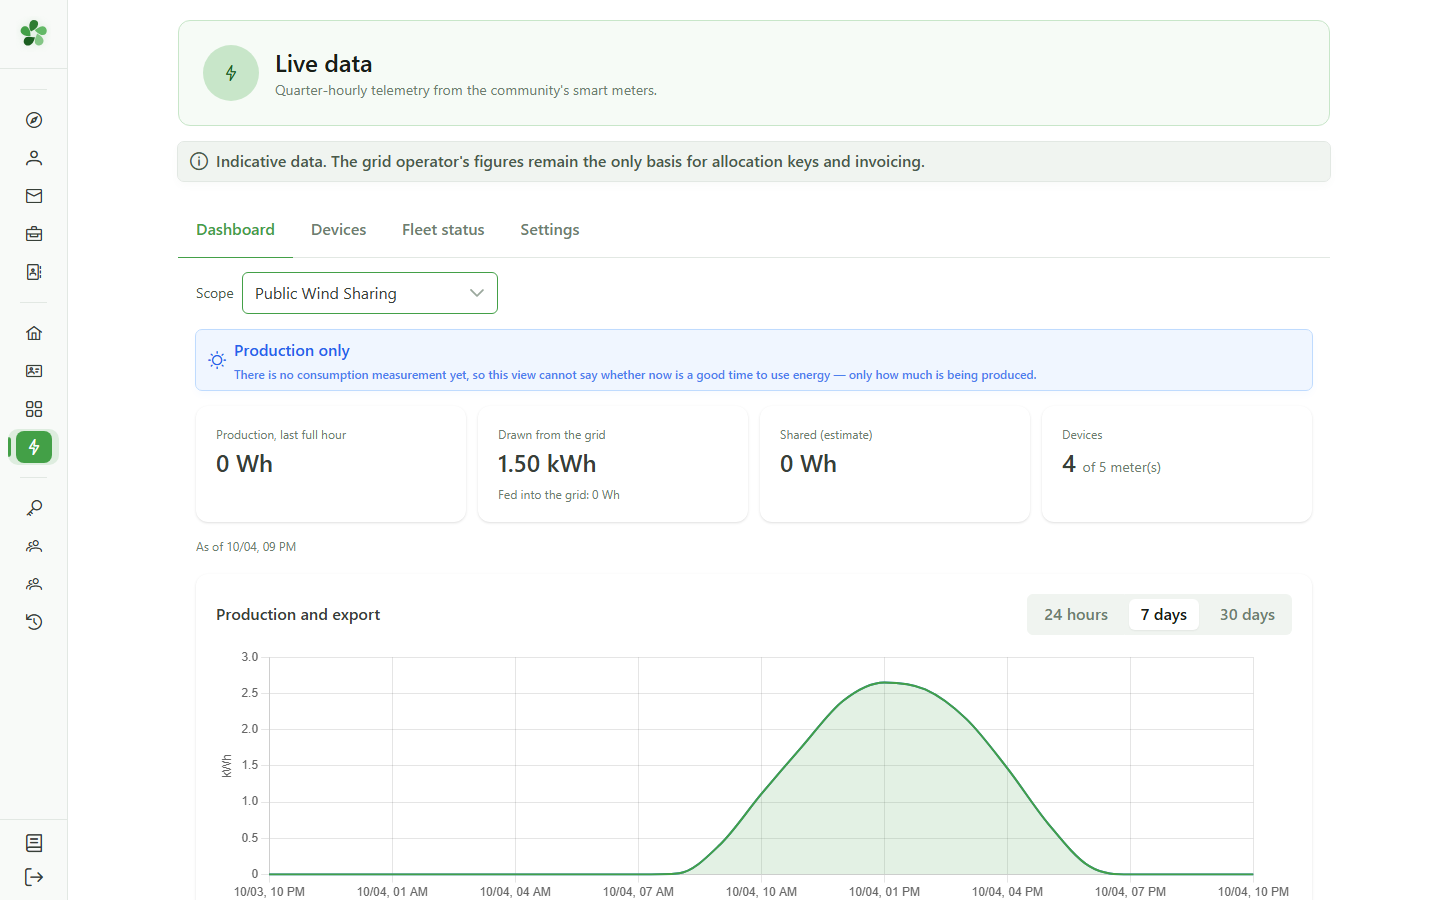
At the top of the dashboard, the "Scope" switches from the whole community to one of its sharing operations. Every figure and chart follows that choice.
4 The operation's figures
Sharing operation
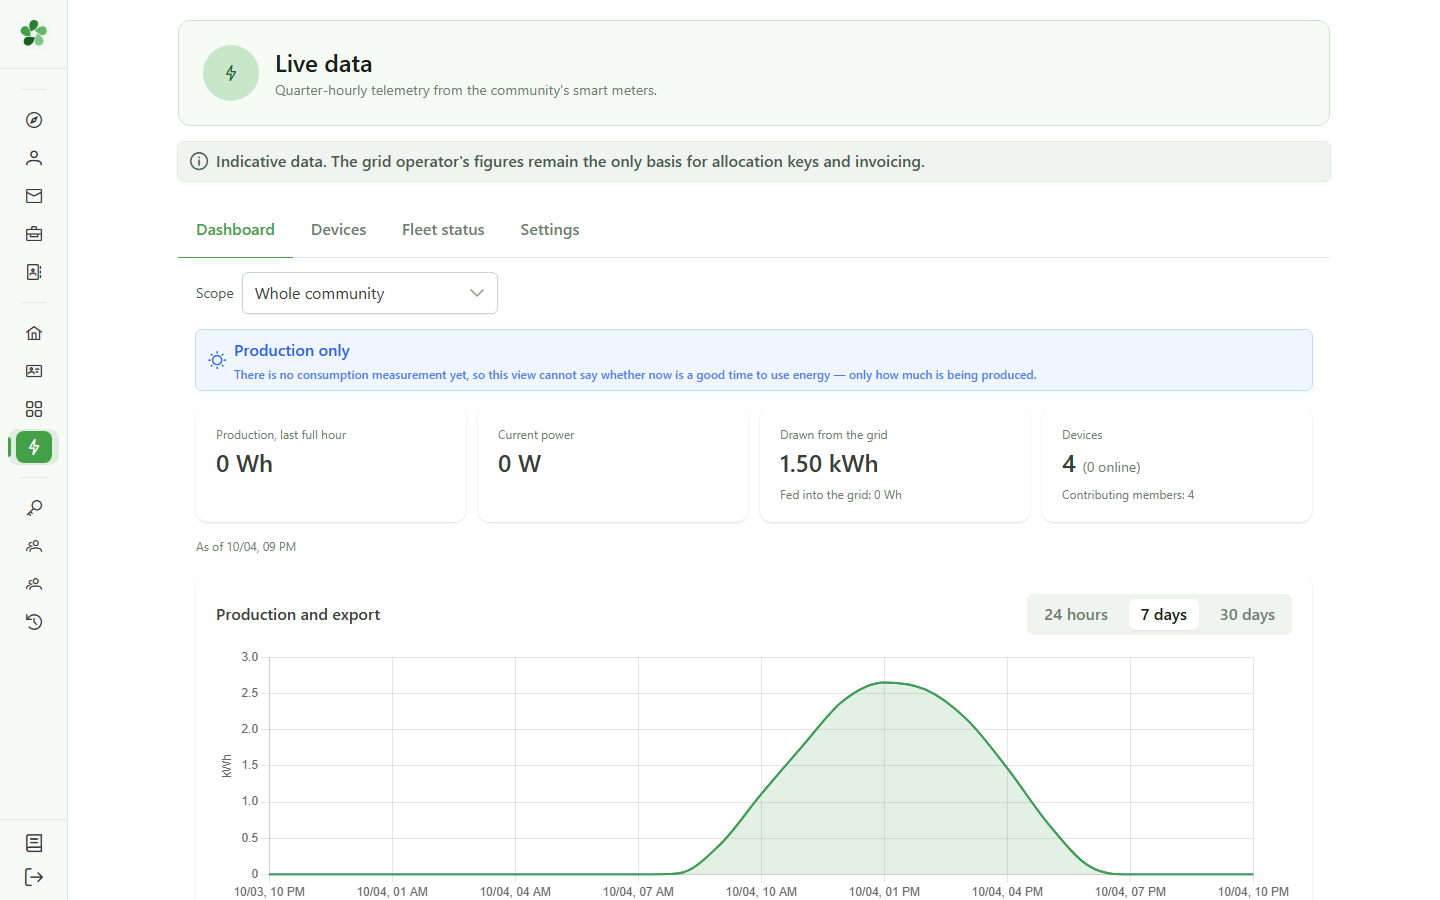
For the chosen operation: its production over the last full hour, its exchanges with the grid, the shared energy (estimate) and how many of its meters are monitored. Grid exchanges and sharing stay hidden while the operation has too few members.
Follow sharing within an operation
Guide utilisateur
User guide
Gebruikershandleiding
Benutzerhandbuch
1 Sharing within the operations
Dashboard
As soon as monitored meters belong to a sharing operation, the dashboard estimates, quarter-hour by quarter-hour, how much of the consumption the operation's production covered and how much of the injection was shared. It is an estimate among the monitored meters: the grid operator's data remains the reference.
2 Consumption drawn from the grid
Dashboard
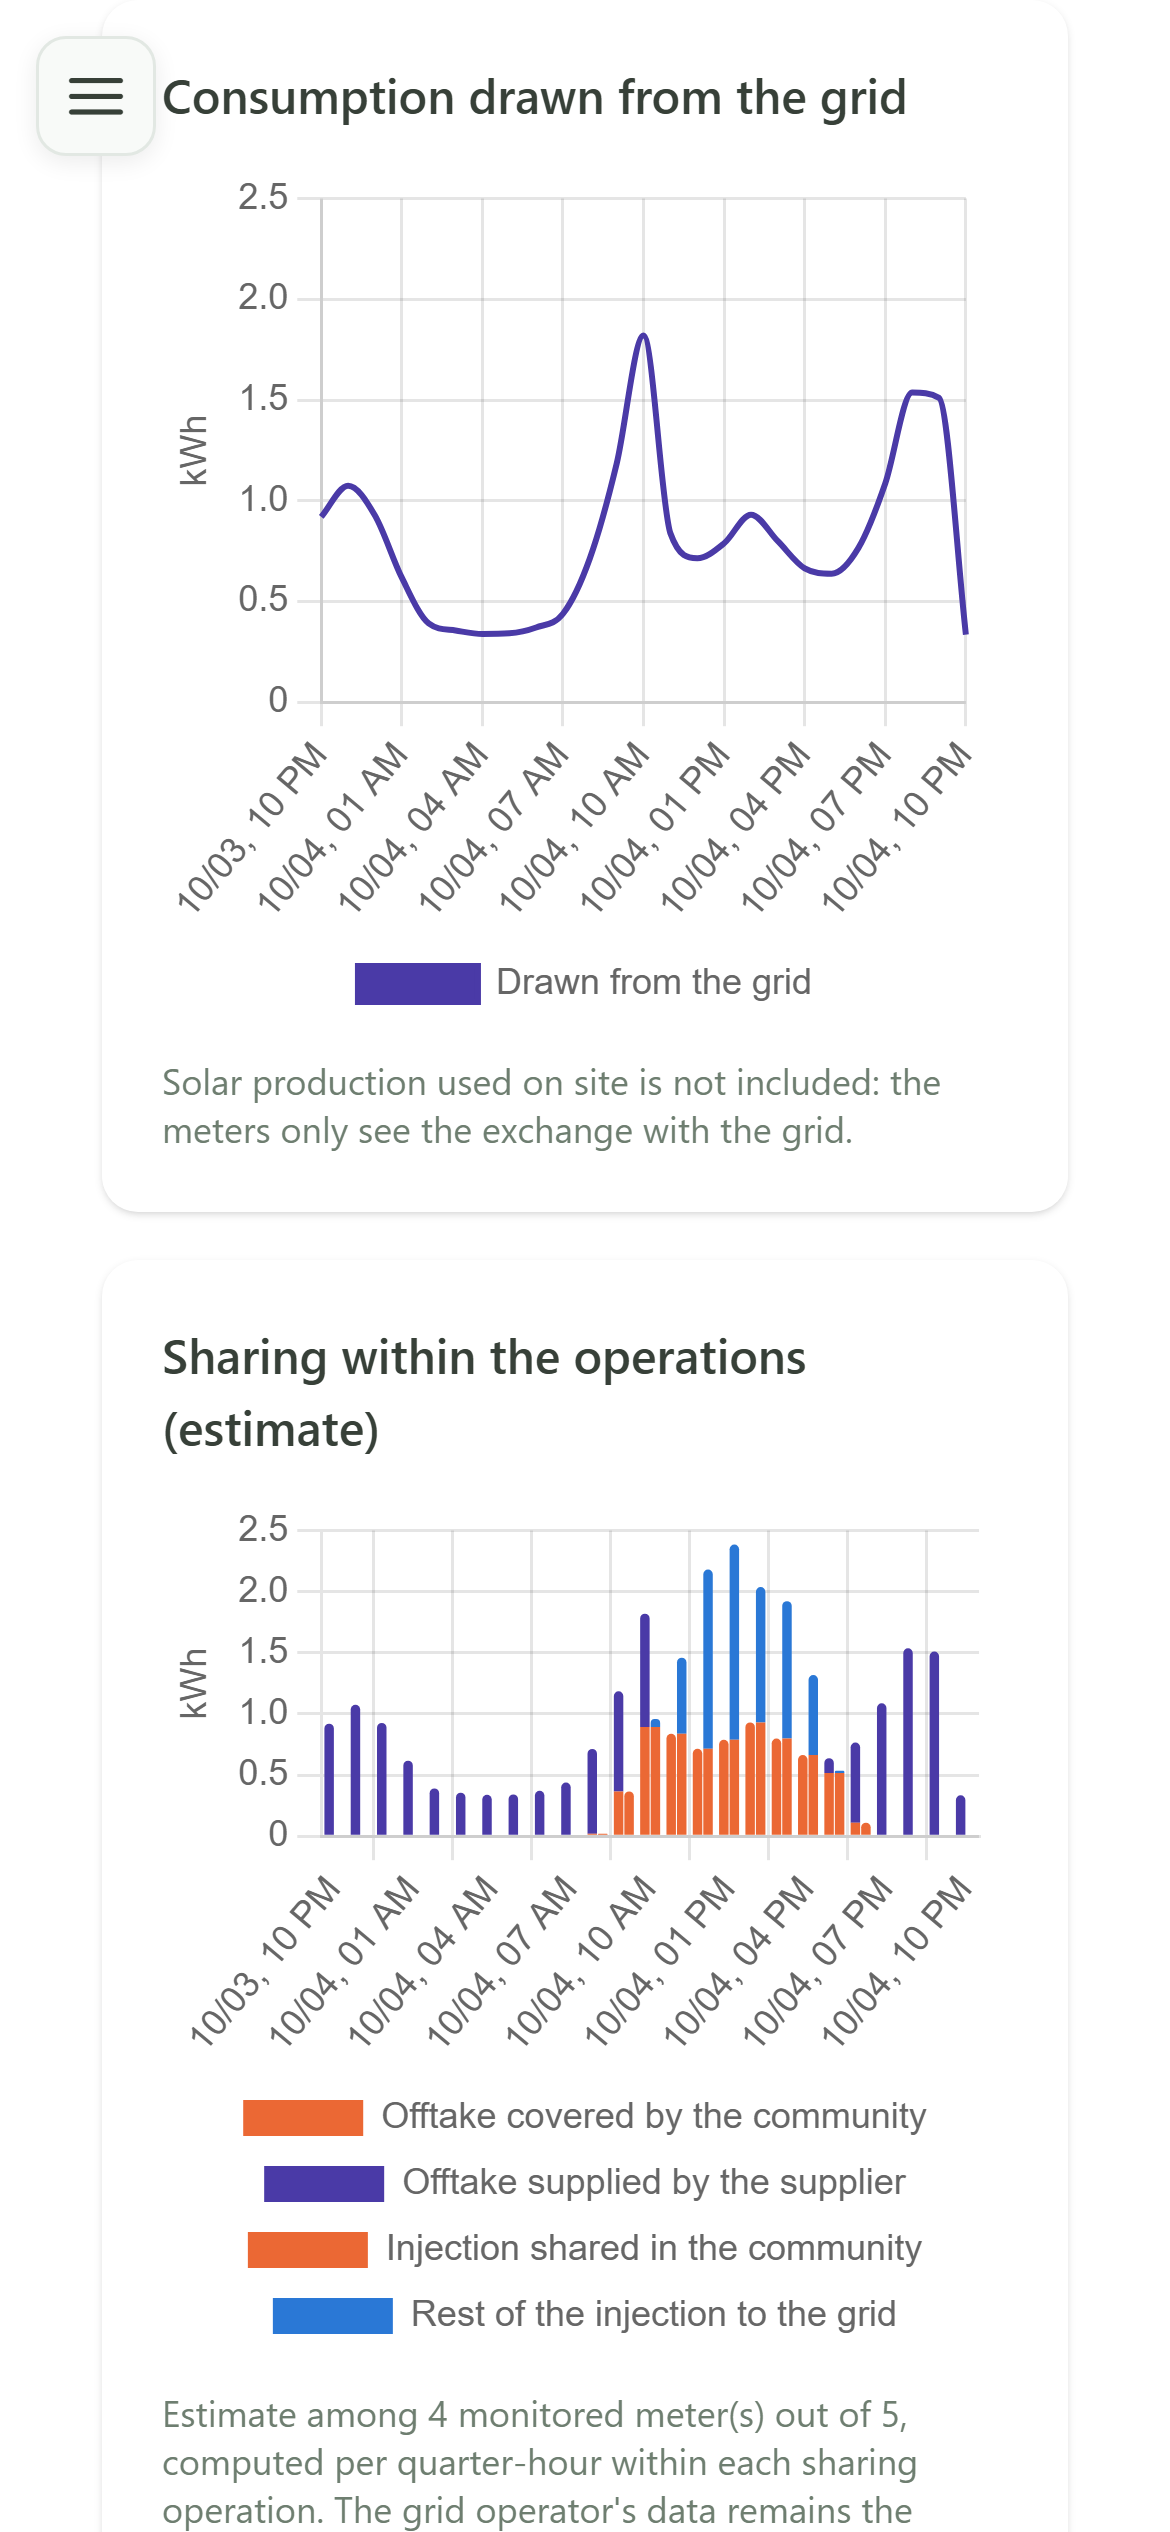
This chart shows the energy the monitored meters drew from the grid. Solar production used on site is not included: the meters only see the exchange with the grid. It stays hidden while too few members contribute.
3 Choose a sharing operation
Scope
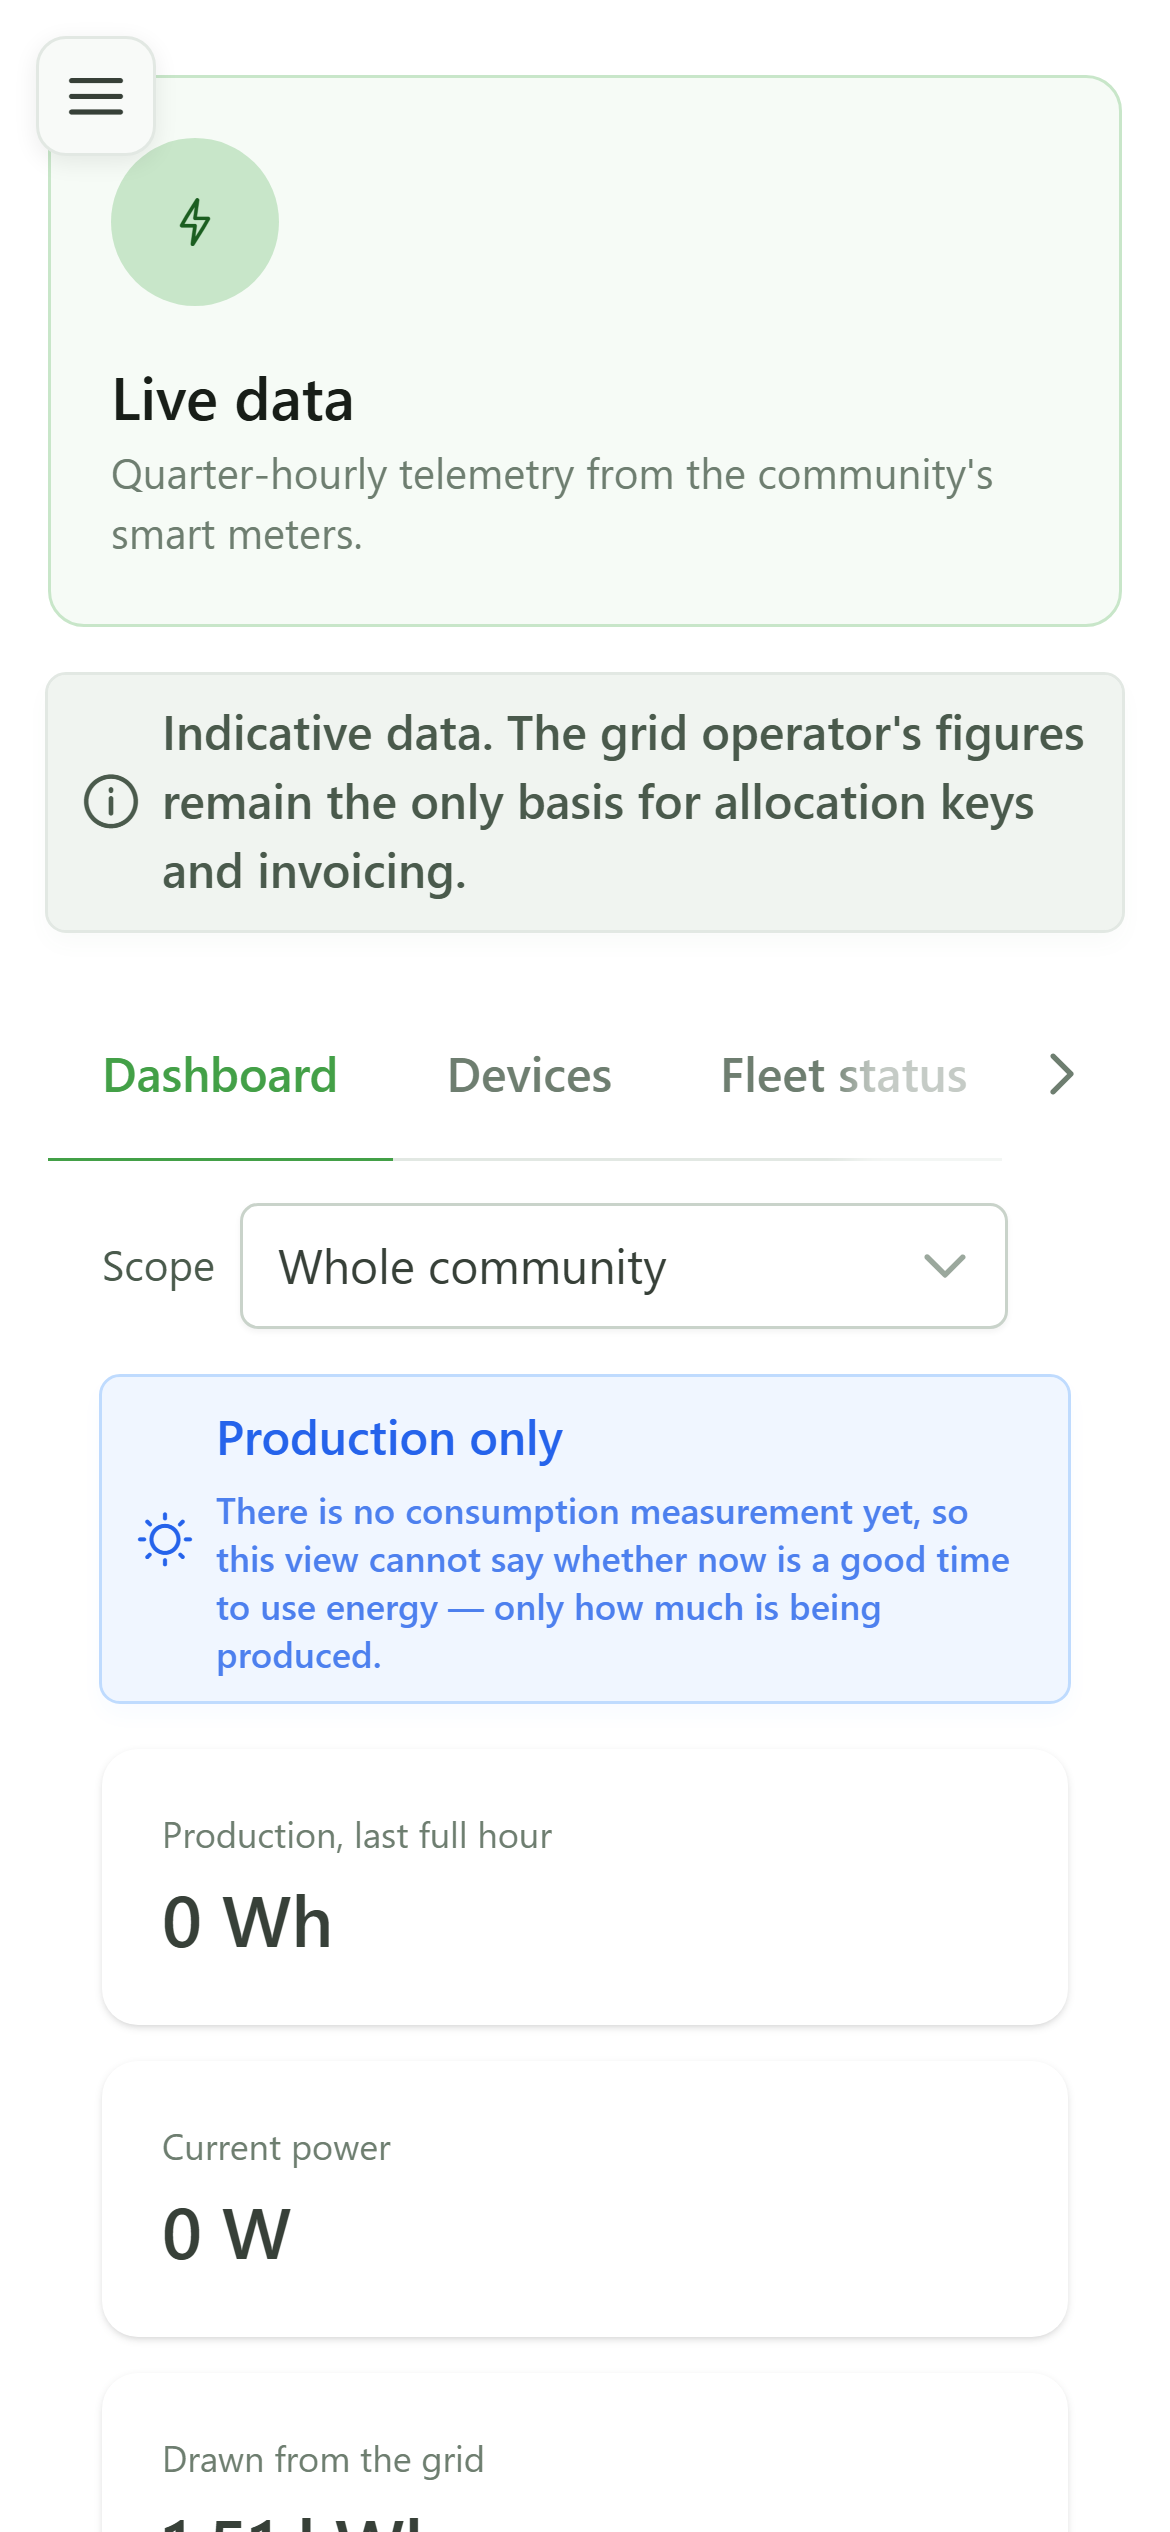
At the top of the dashboard, the "Scope" switches from the whole community to one of its sharing operations. Every figure and chart follows that choice.
4 The operation's figures
Sharing operation
For the chosen operation: its production over the last full hour, its exchanges with the grid, the shared energy (estimate) and how many of its meters are monitored. Grid exchanges and sharing stay hidden while the operation has too few members.