Discover Live data
Guide utilisateur
User guide
Gebruikershandleiding
Benutzerhandbuch
1 Open Live data
Navigation
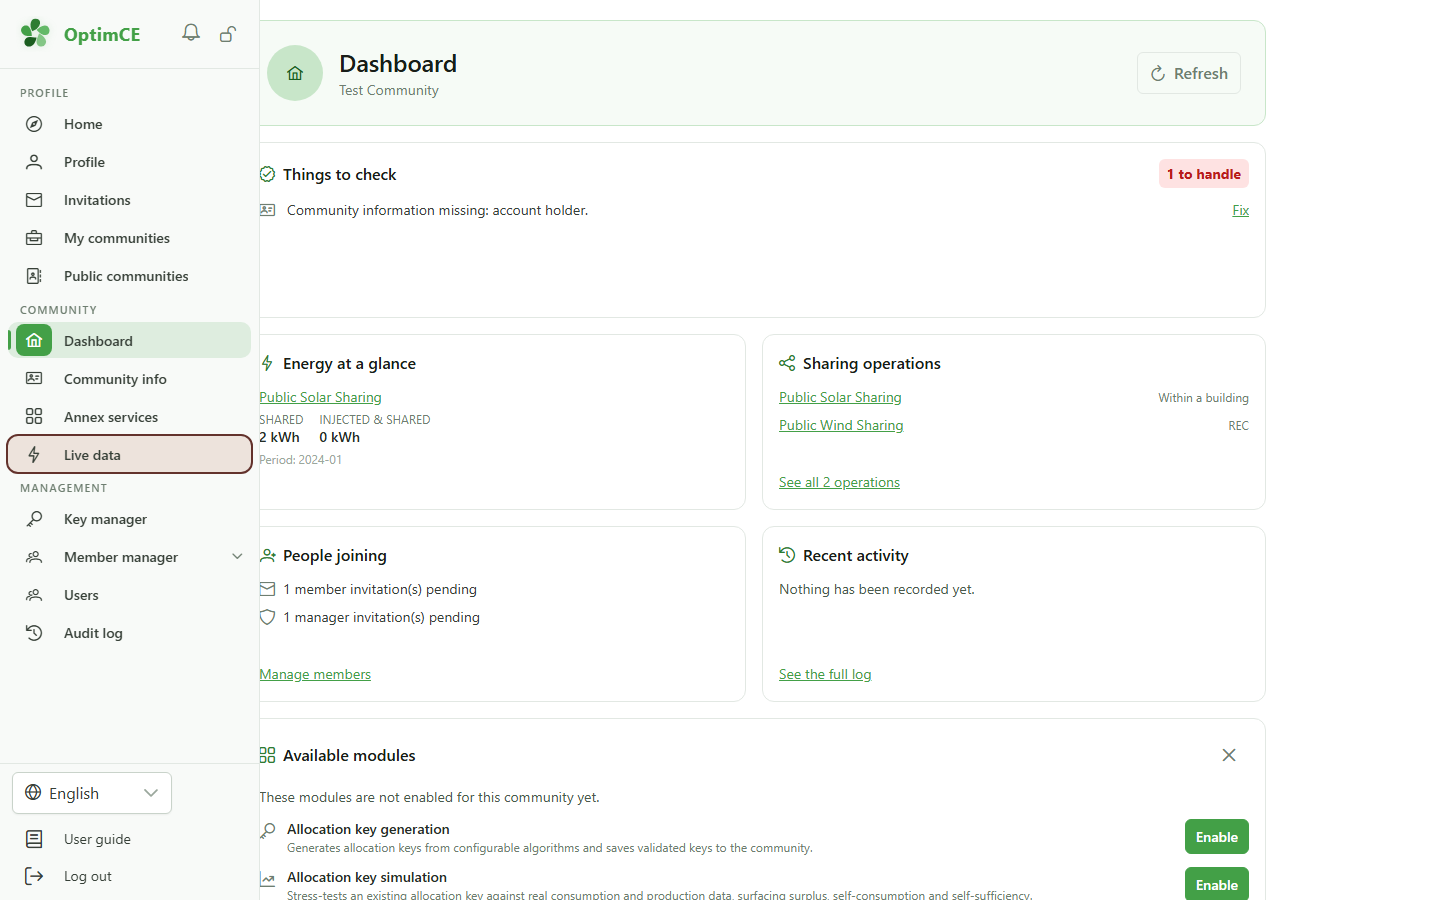
In the sidebar, click "Live data". The link appears as soon as the community is subscribed to the module, and only for its managers.
2 The Live data console
Live data
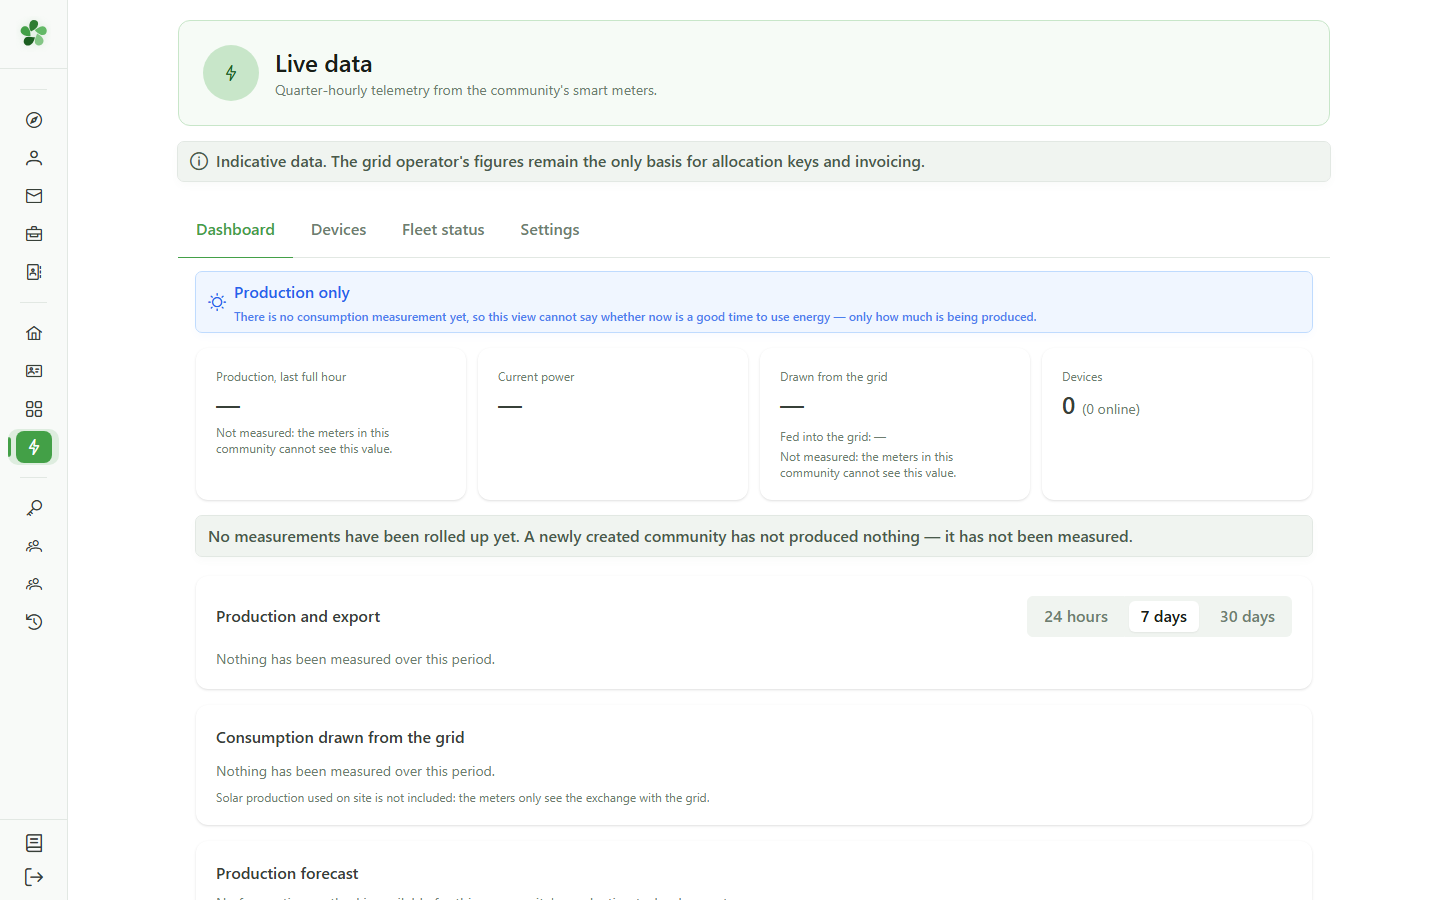
This console follows, quarter-hour by quarter-hour, what the devices installed at members' premises measure. The figures are indicative: only the grid operator's data is used for allocation keys and invoicing.
3 The dashboard
Dashboard
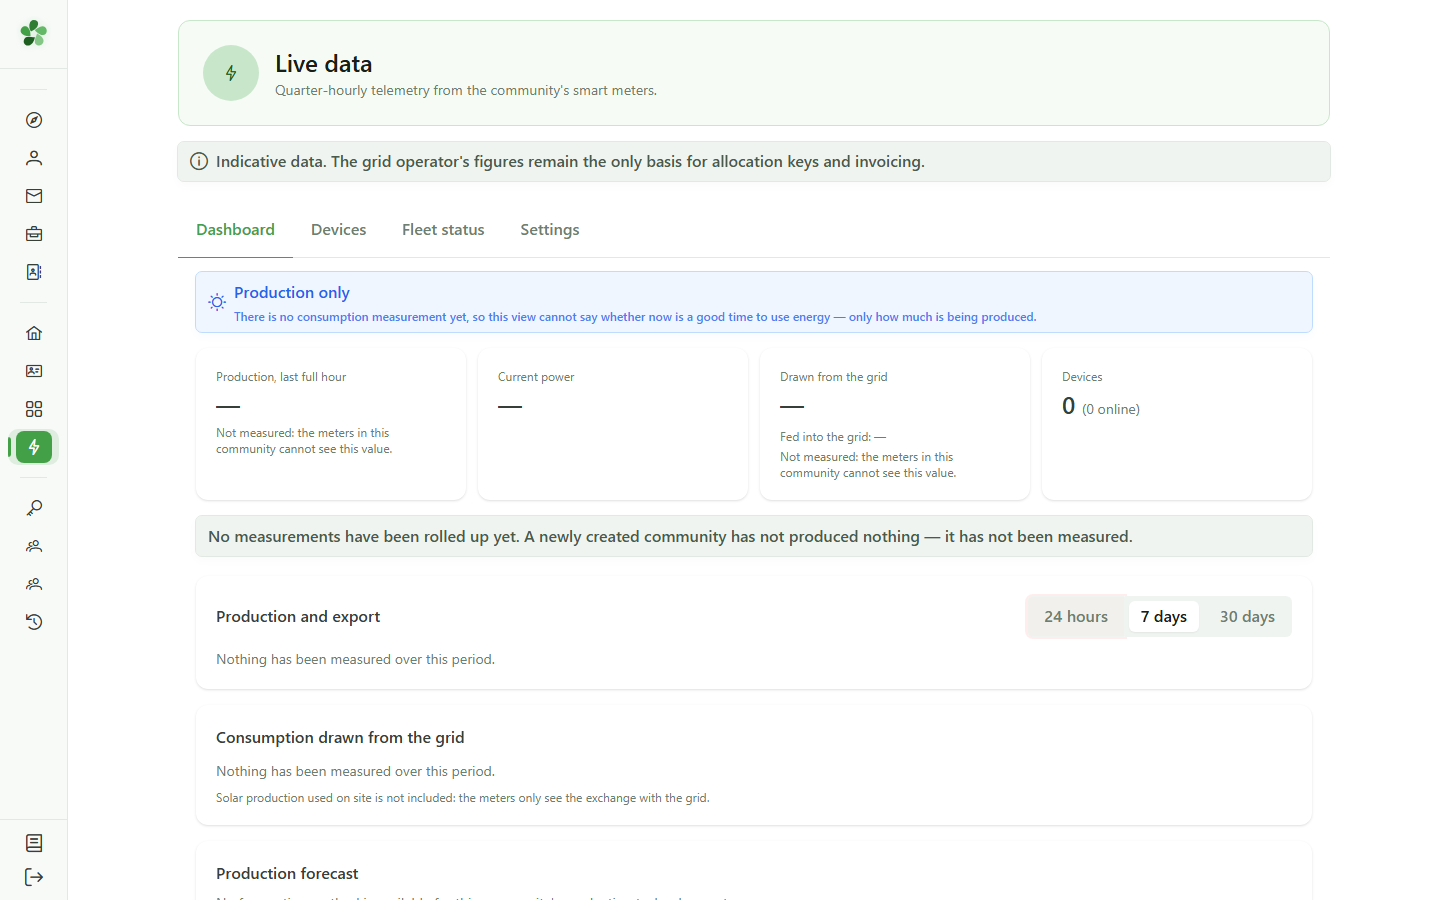
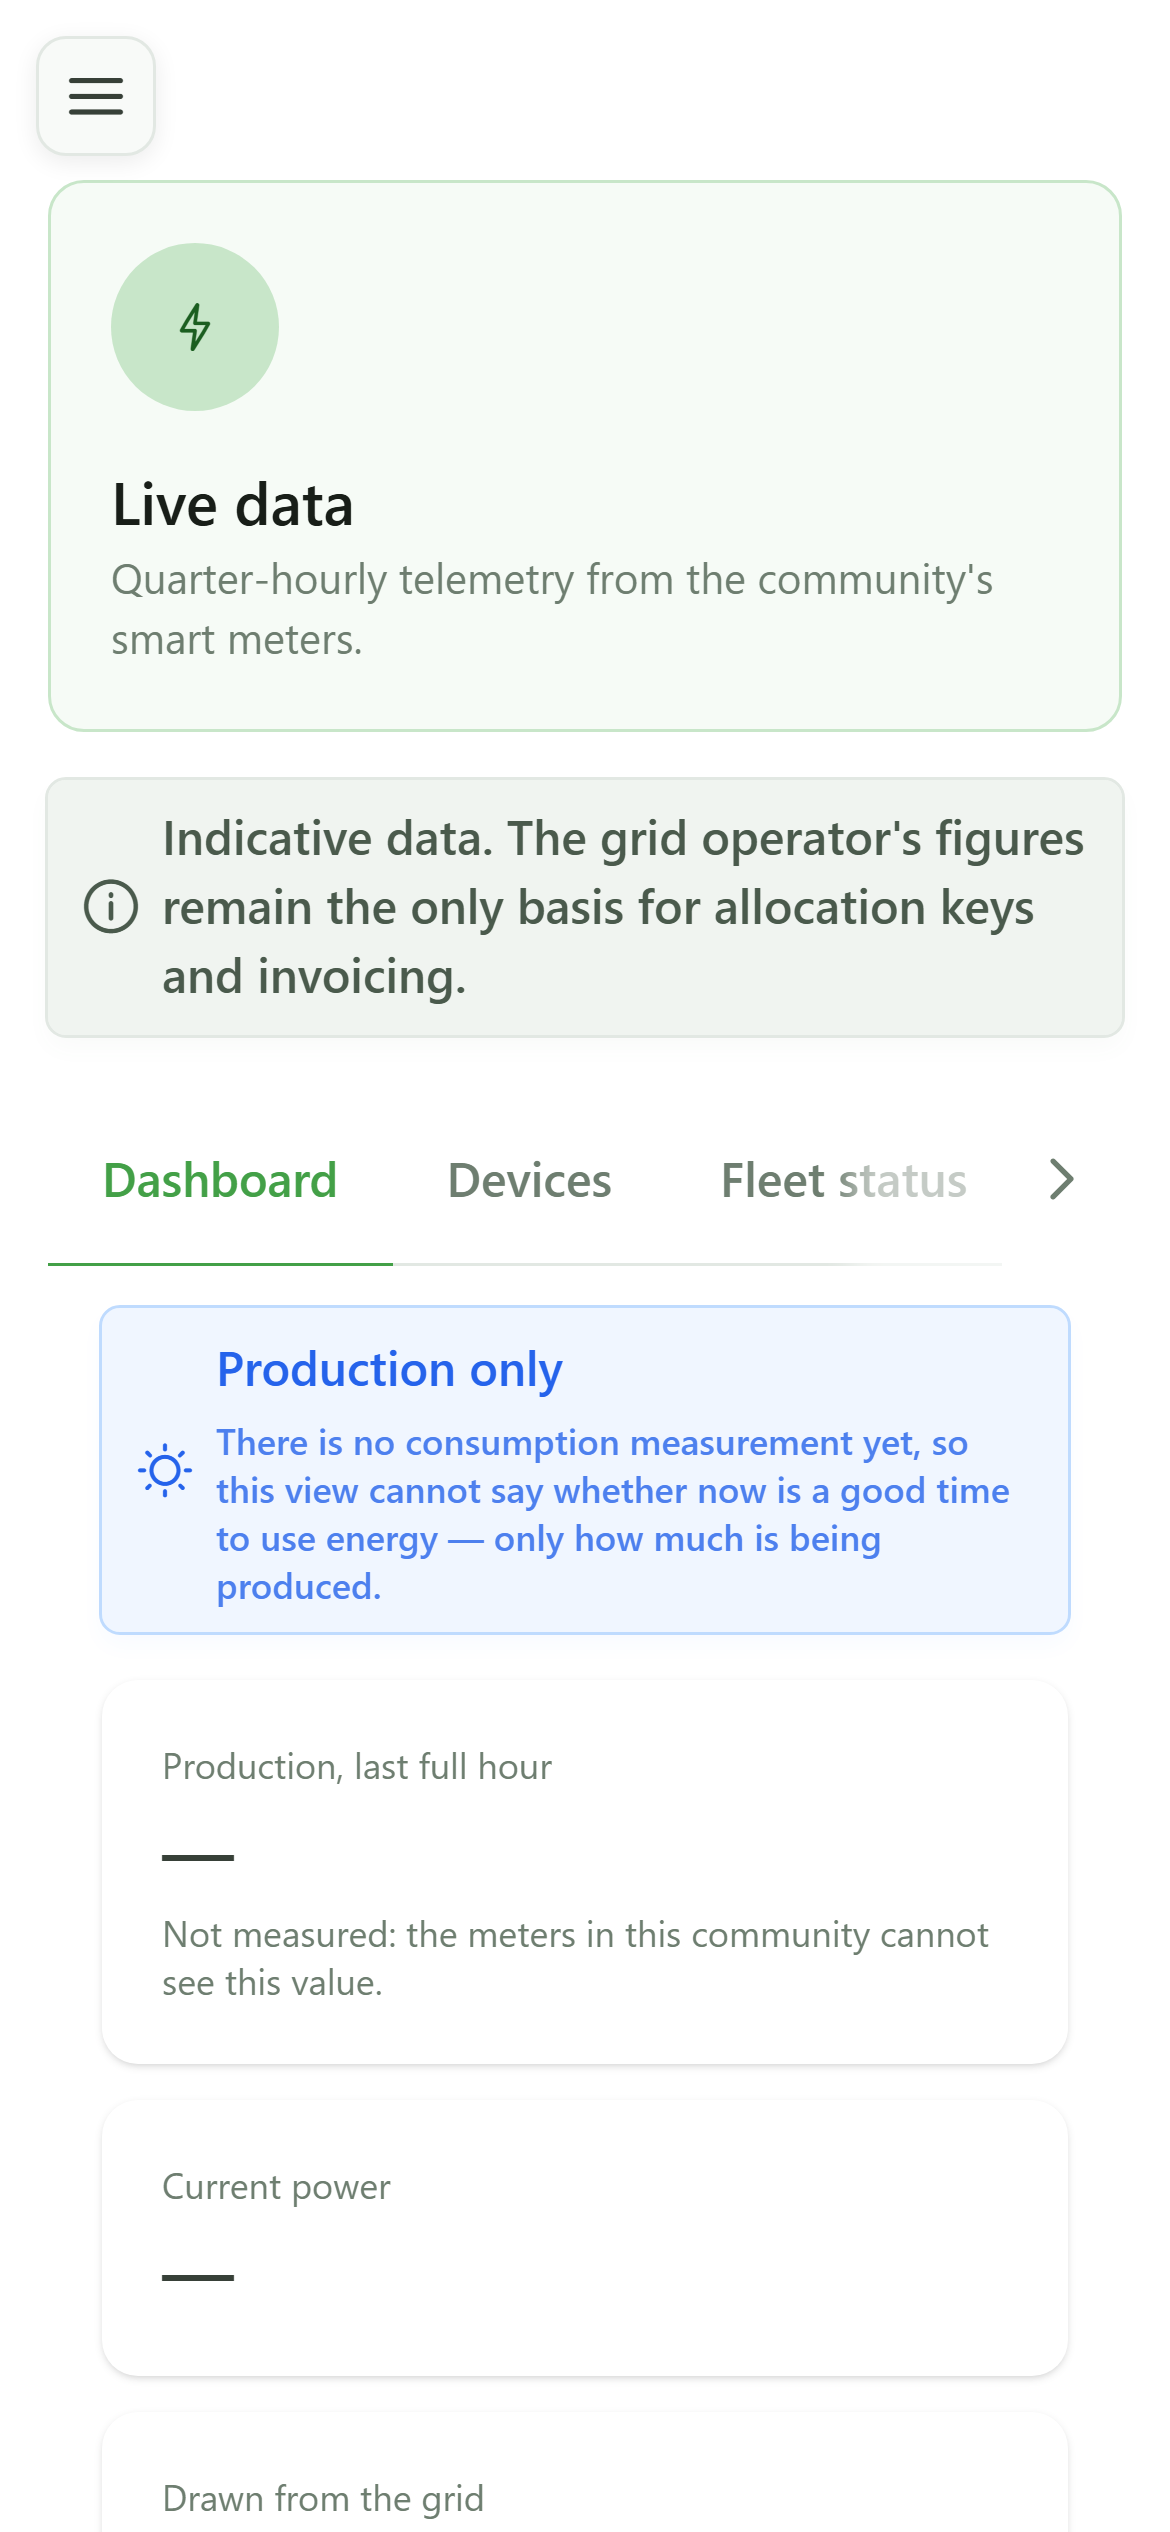
The dashboard sums up the last full hour: production, power, grid exchanges and the state of the fleet. Until a device has sent a reading, every card shows a dash rather than a zero — "not measured yet" is not "nothing produced".
4 Choose the chart period
Dashboard
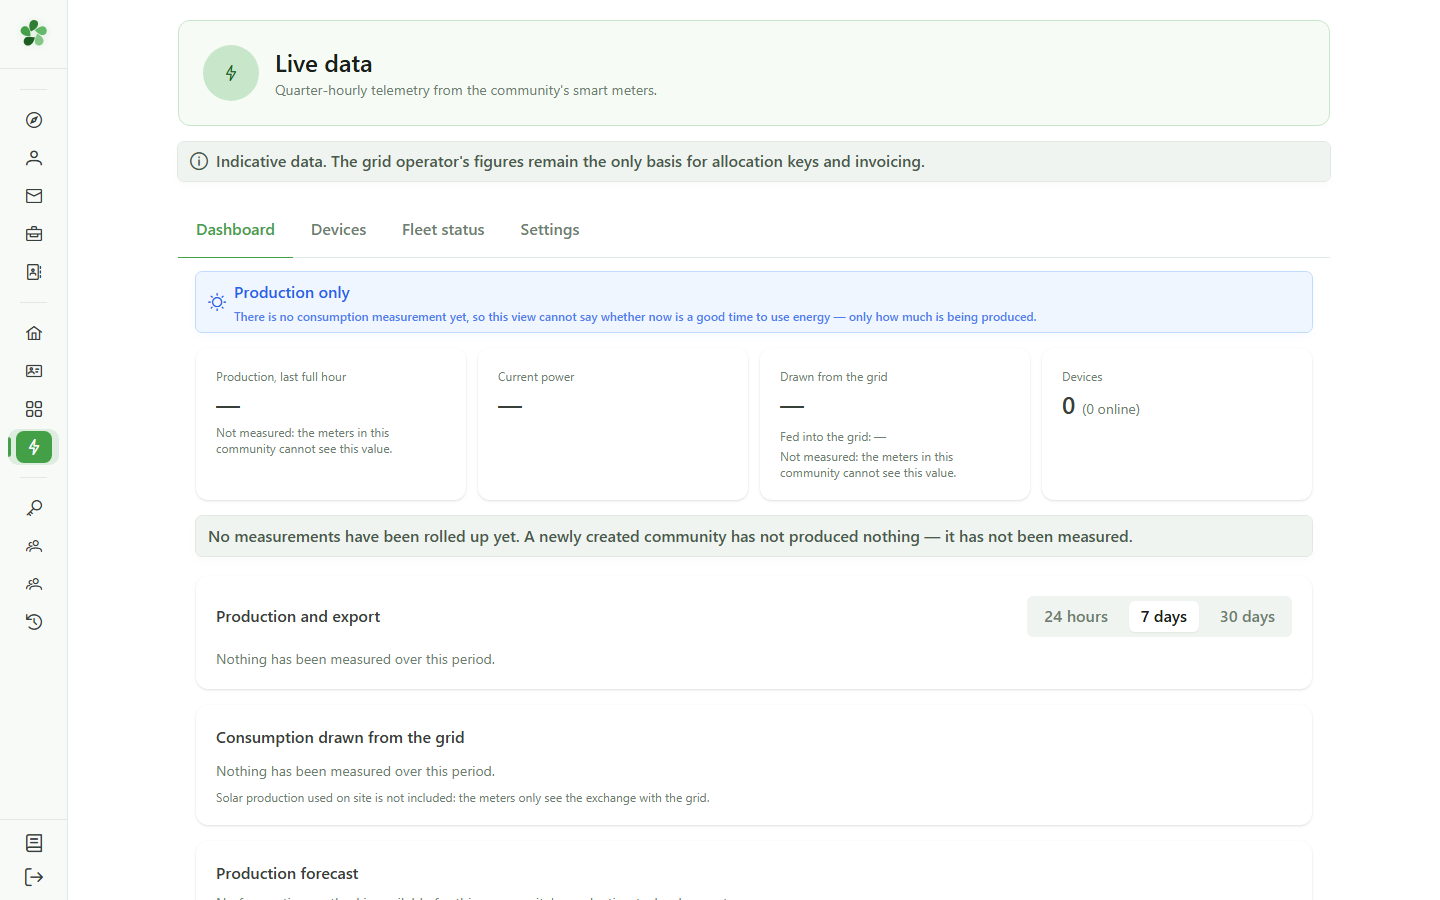
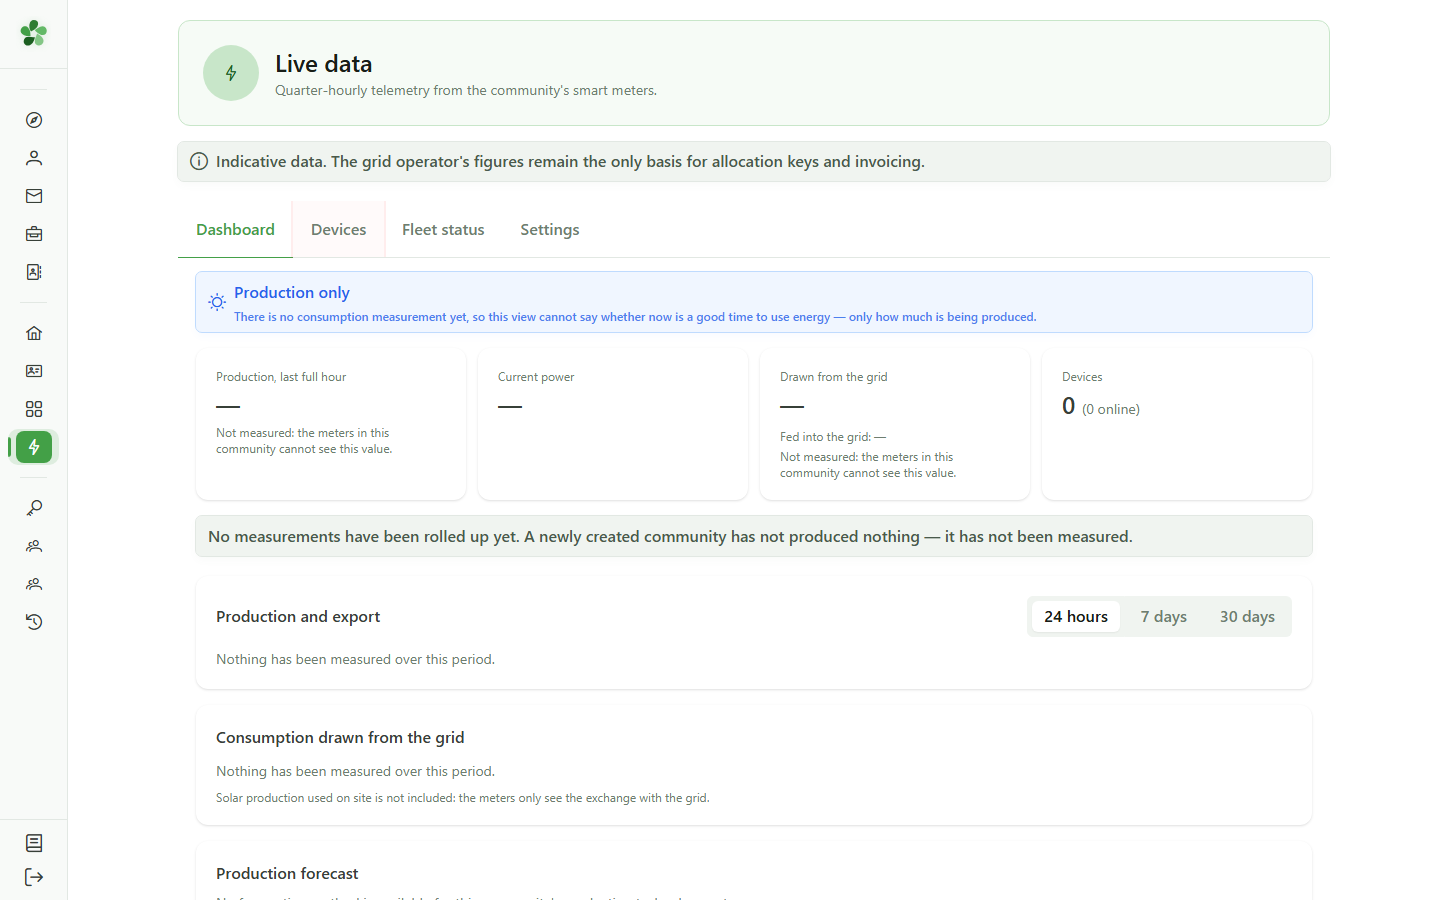
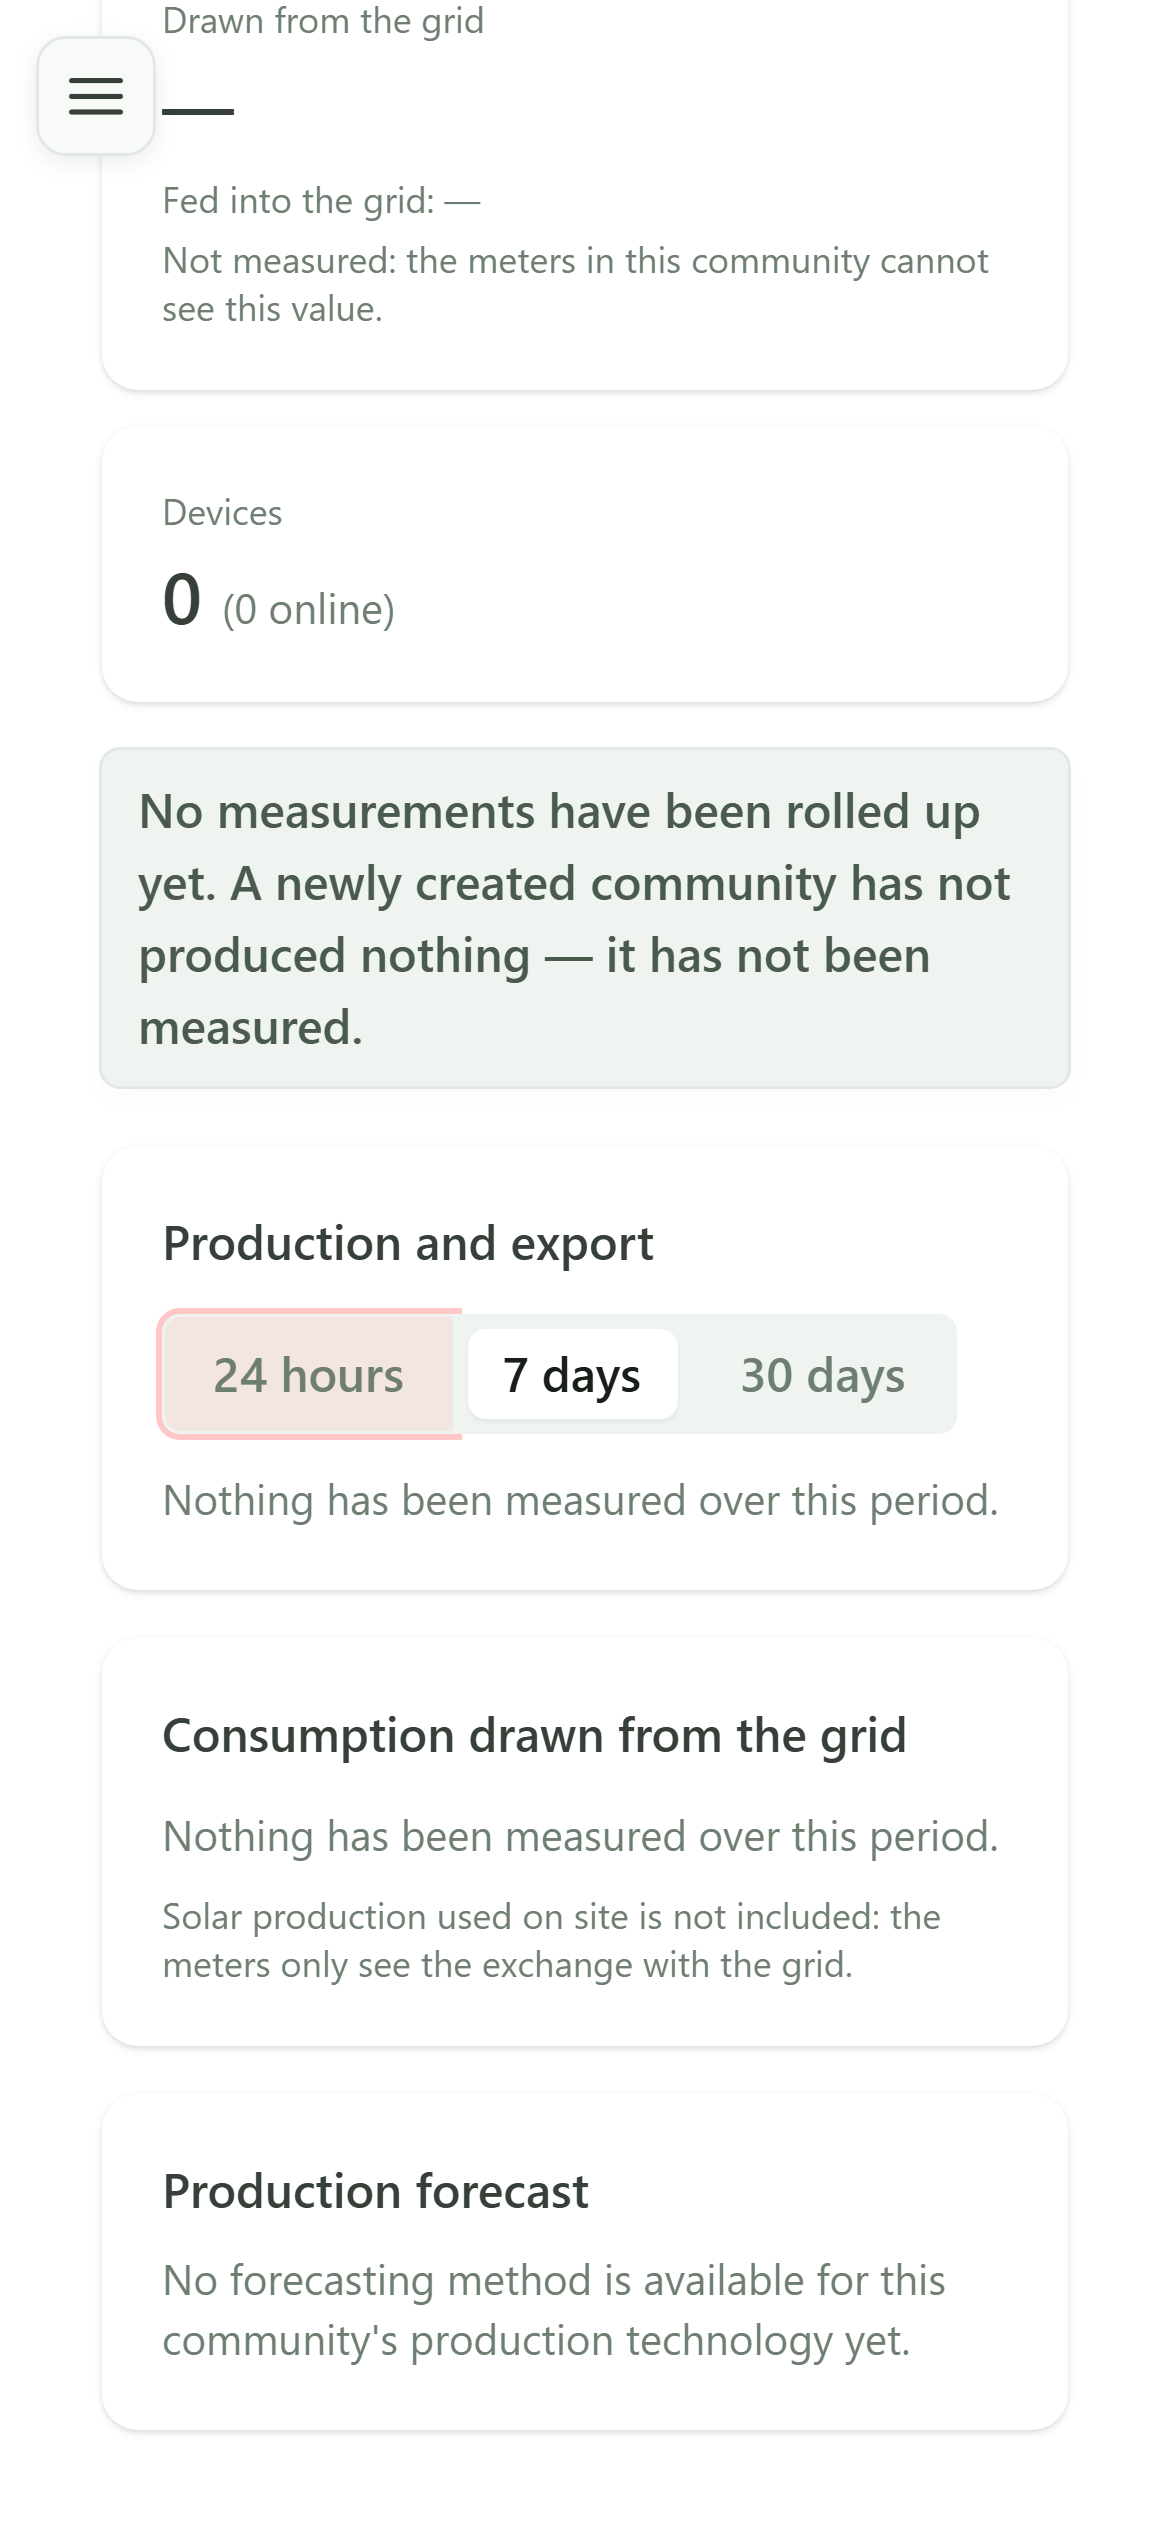
The charts — production and export, then consumption drawn from the grid — cover 24 hours (per quarter-hour), 7 days (per hour) or 30 days (per day). While nothing has been measured, they say so instead of drawing a flat line at zero.
5 The devices
Devices
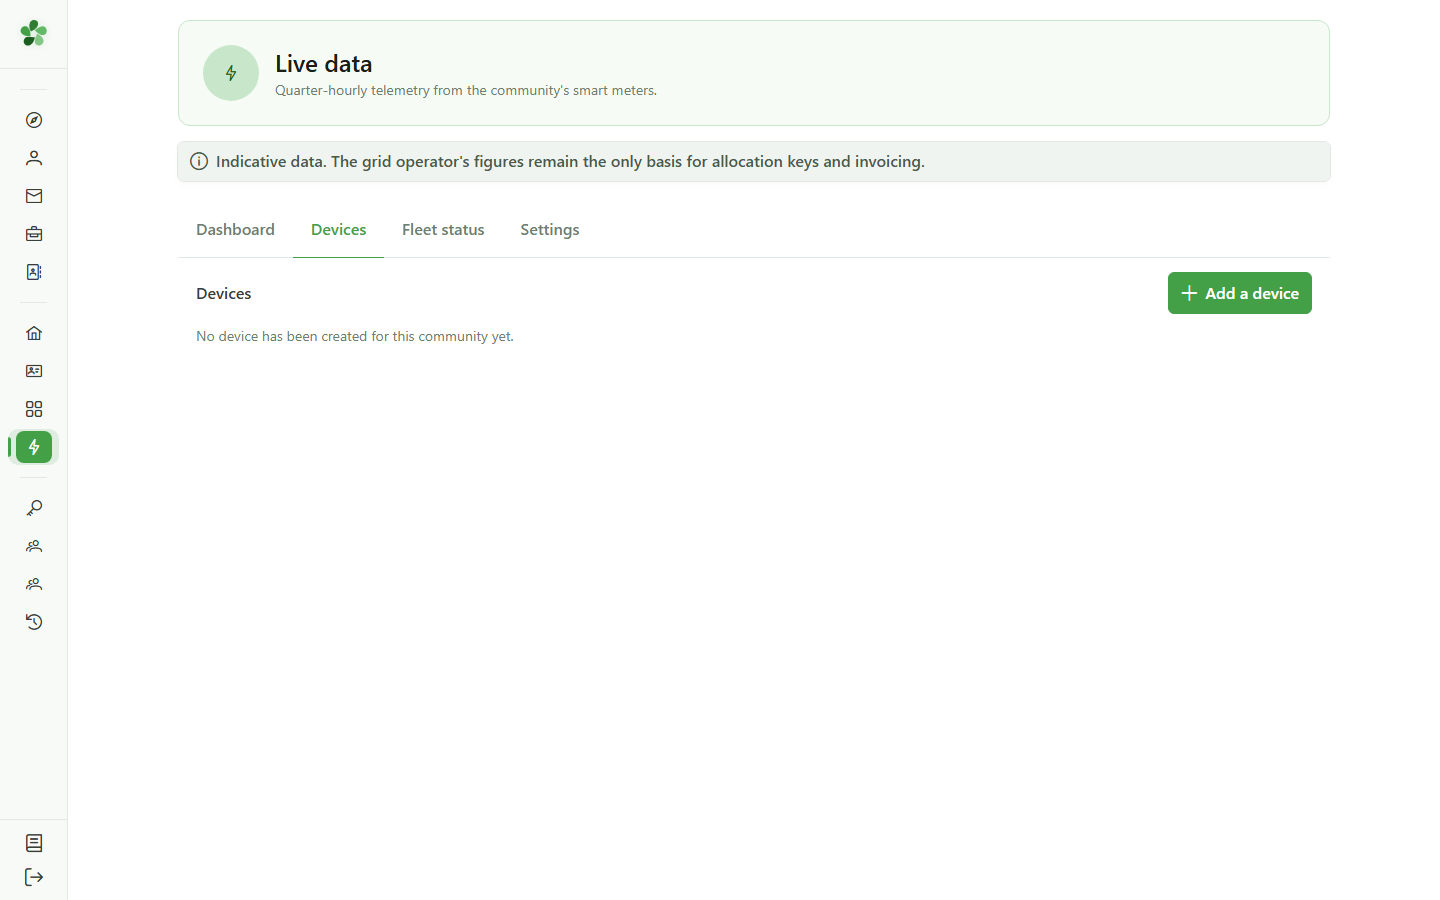
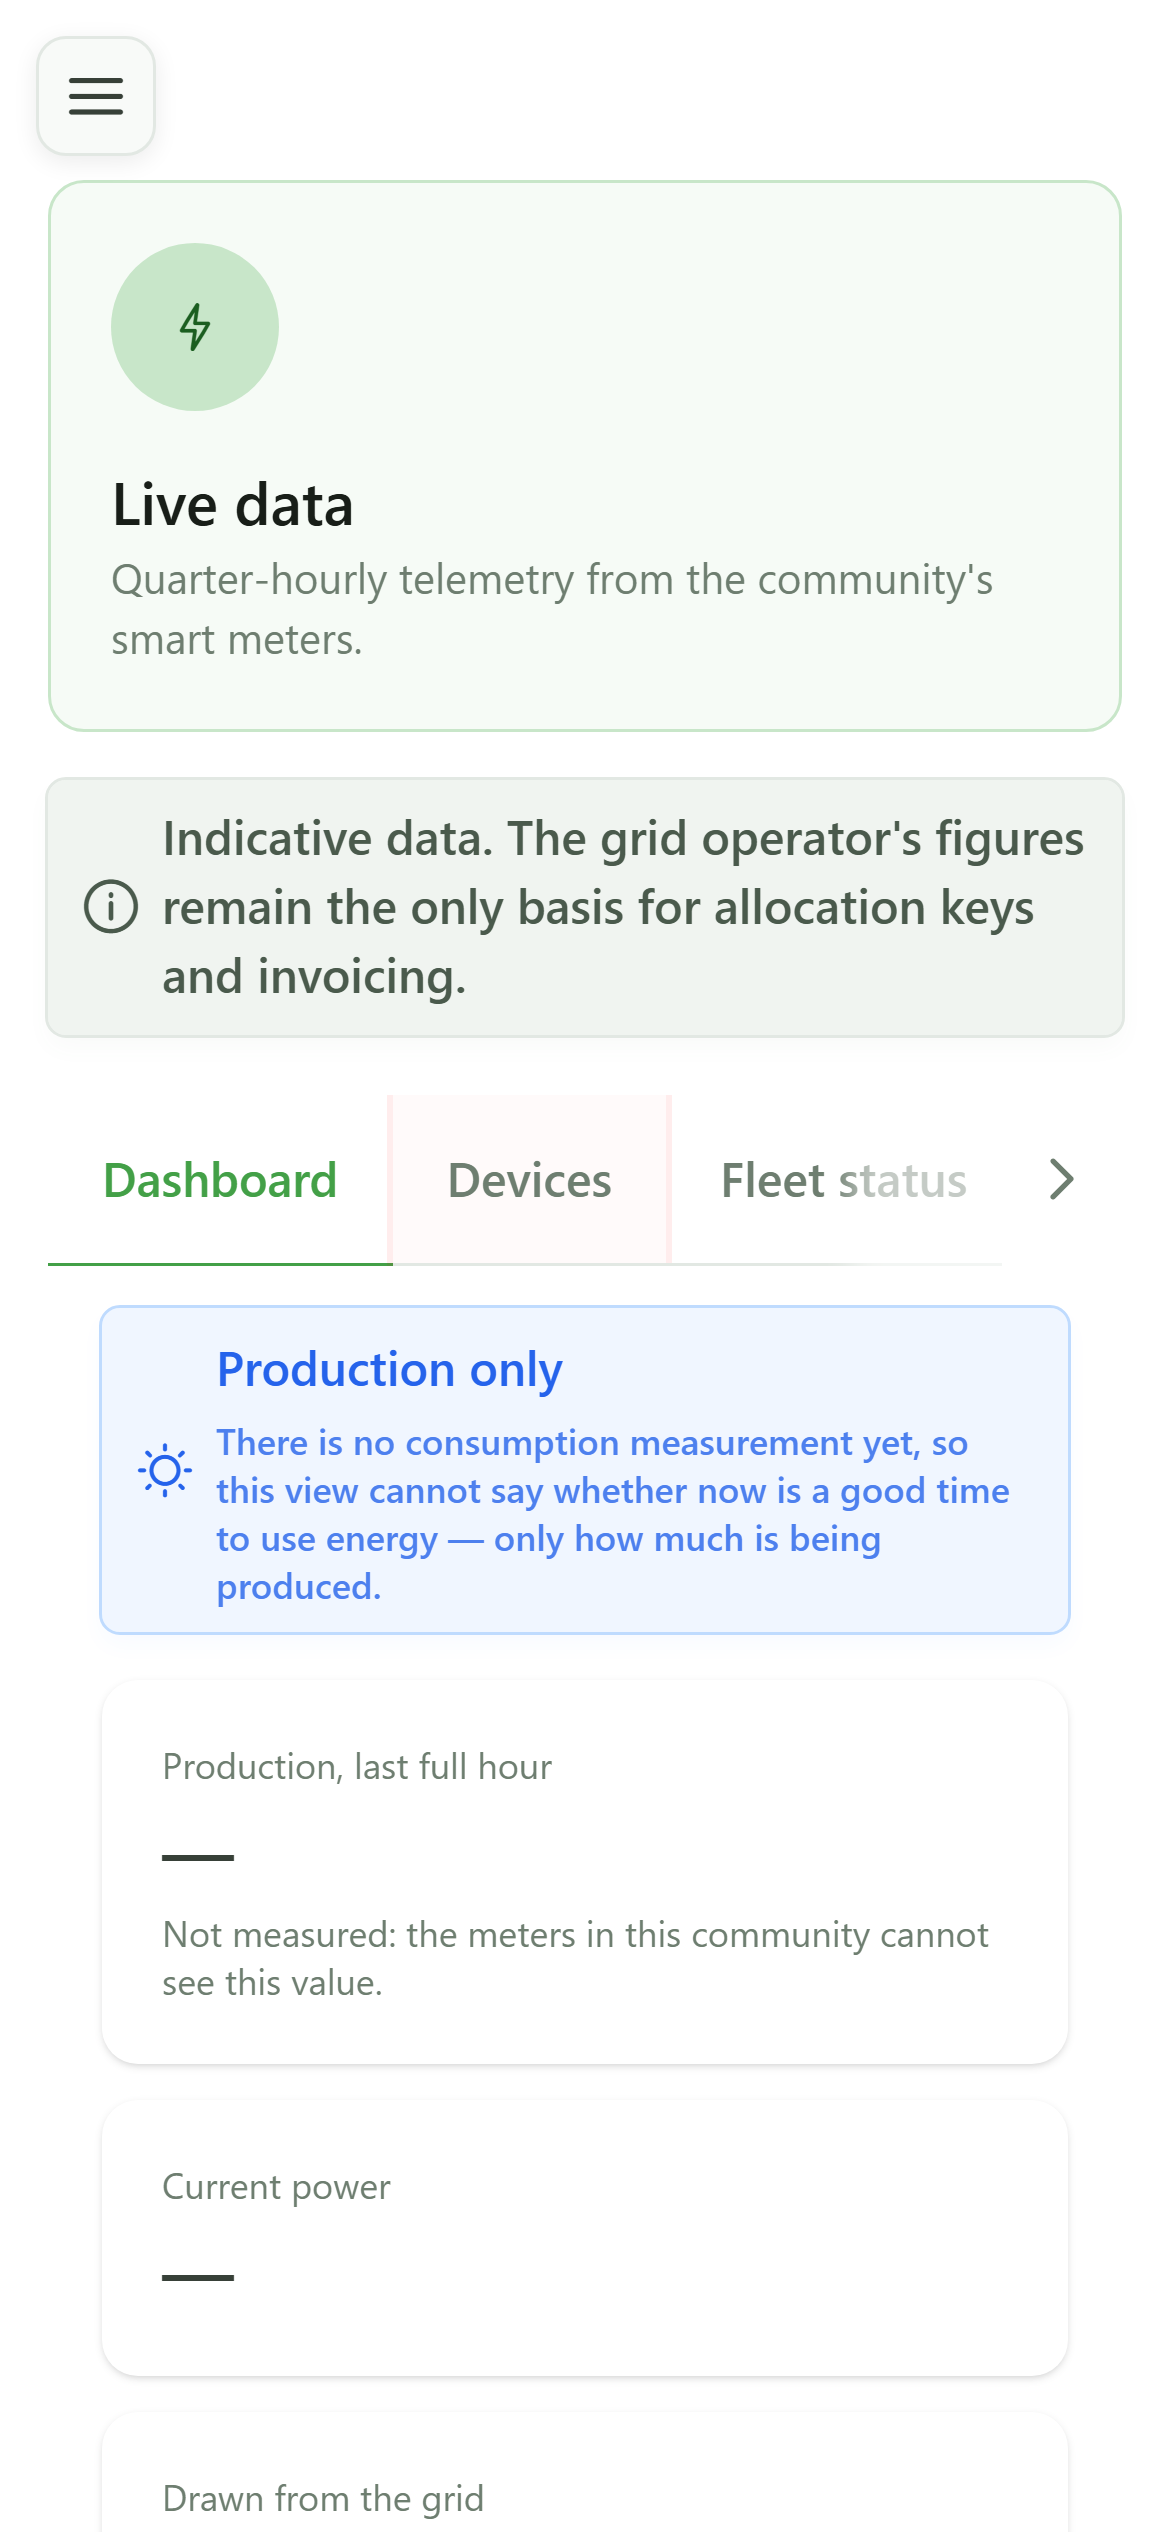
The "Devices" tab lists the boxes connected to the members' meters, with their reporting state.
6 No device yet
Devices
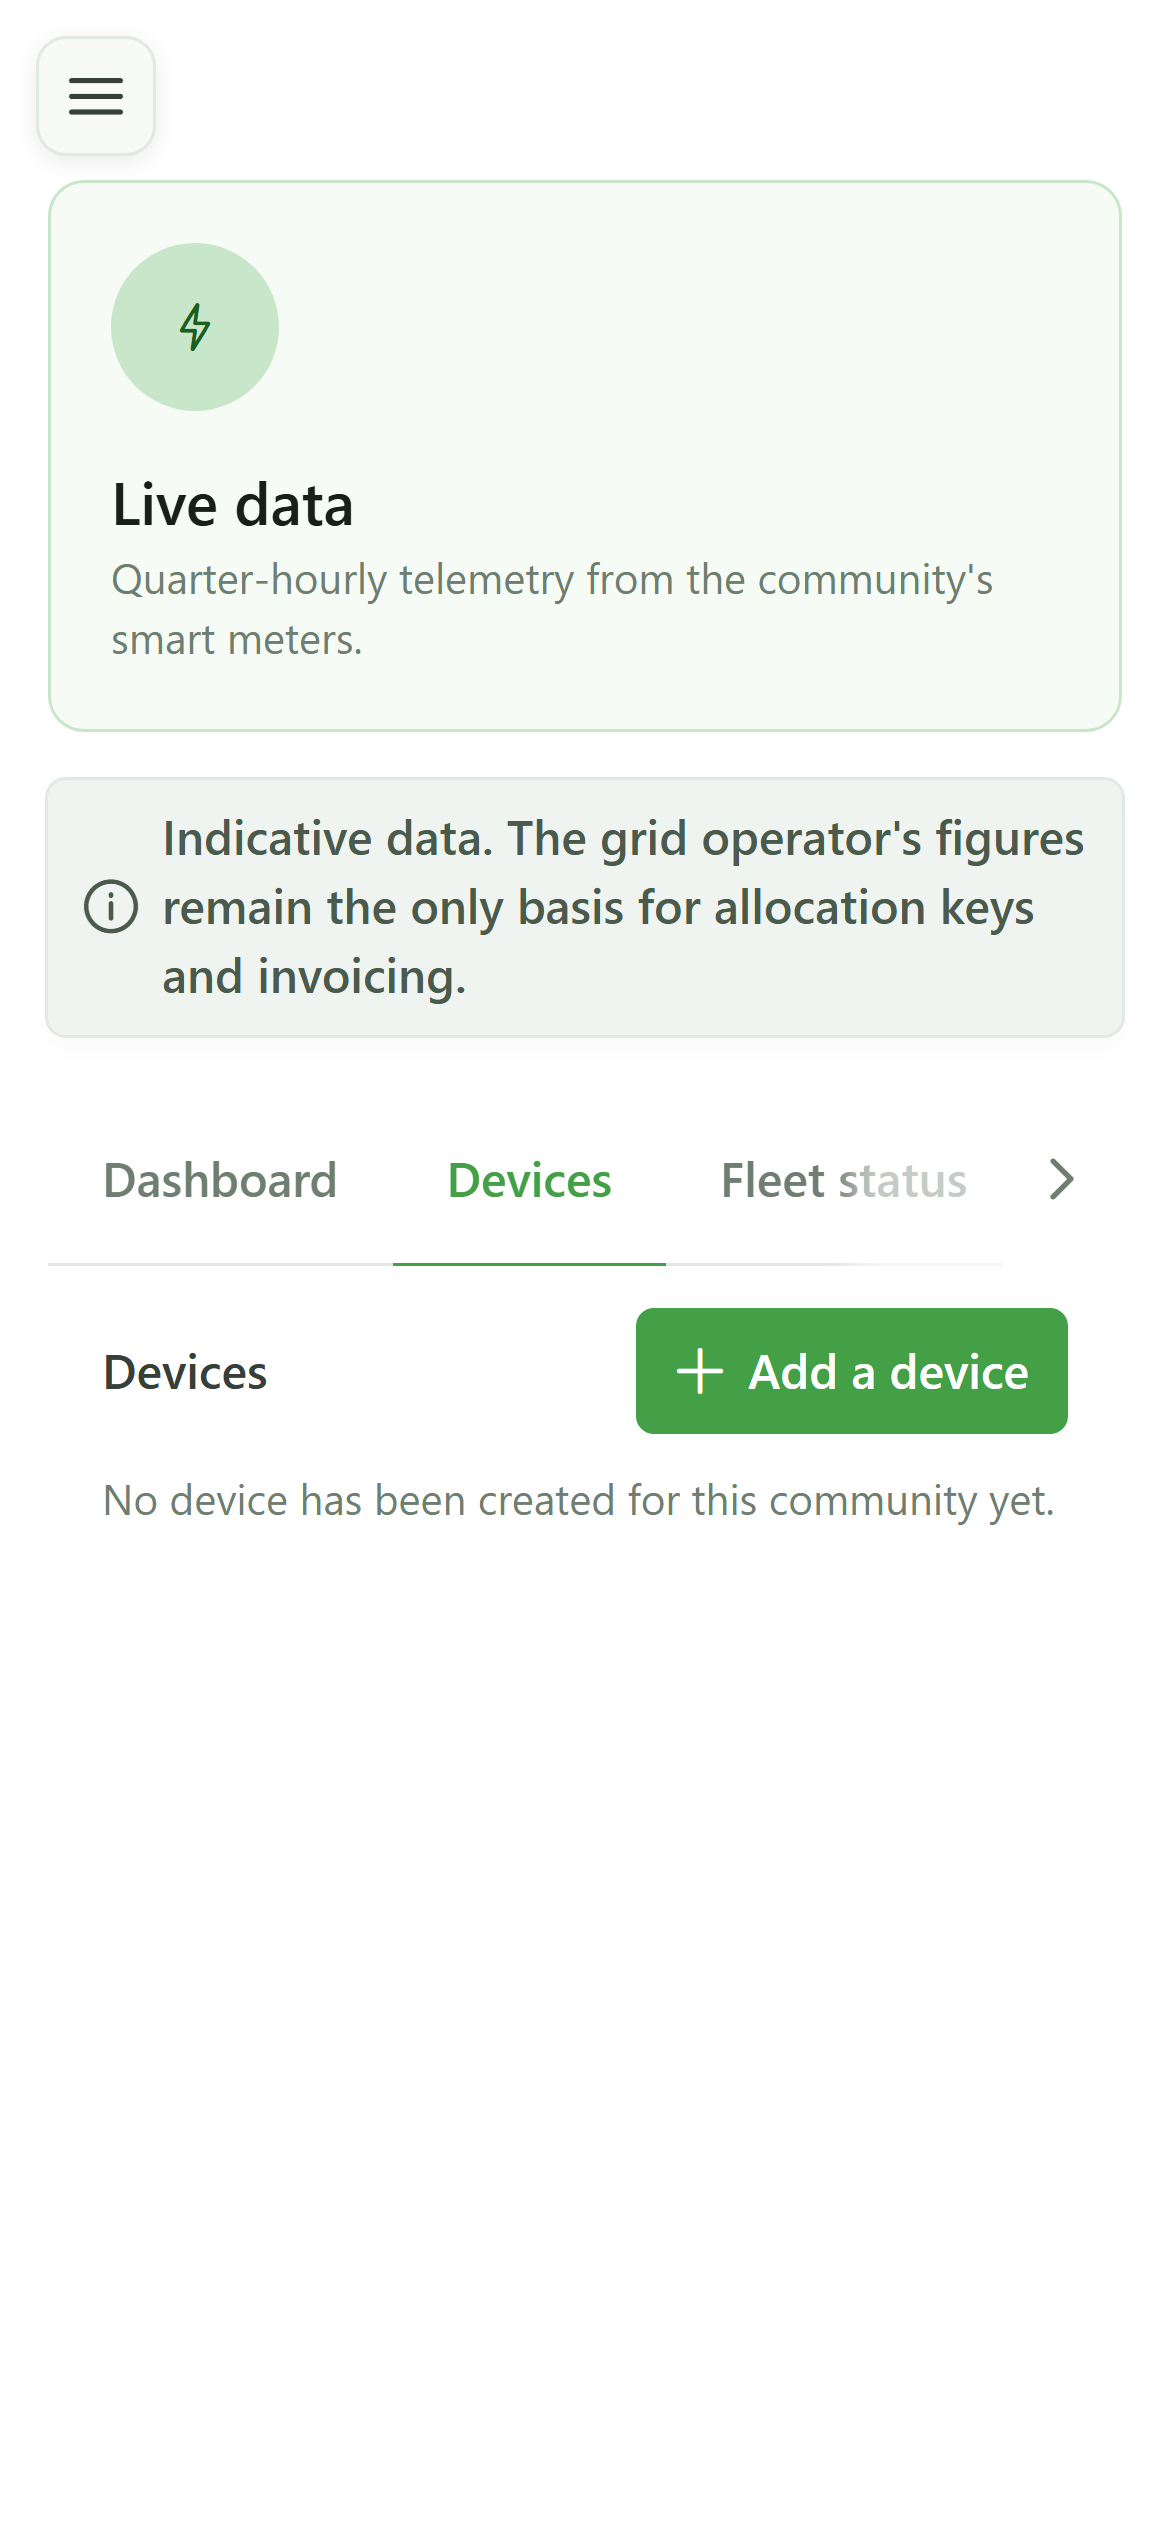
The community has no device yet. The "Add a device" button creates a device for a meter and issues its enrolment code — see the "Connect a device" guide.
7 The fleet status
Fleet status
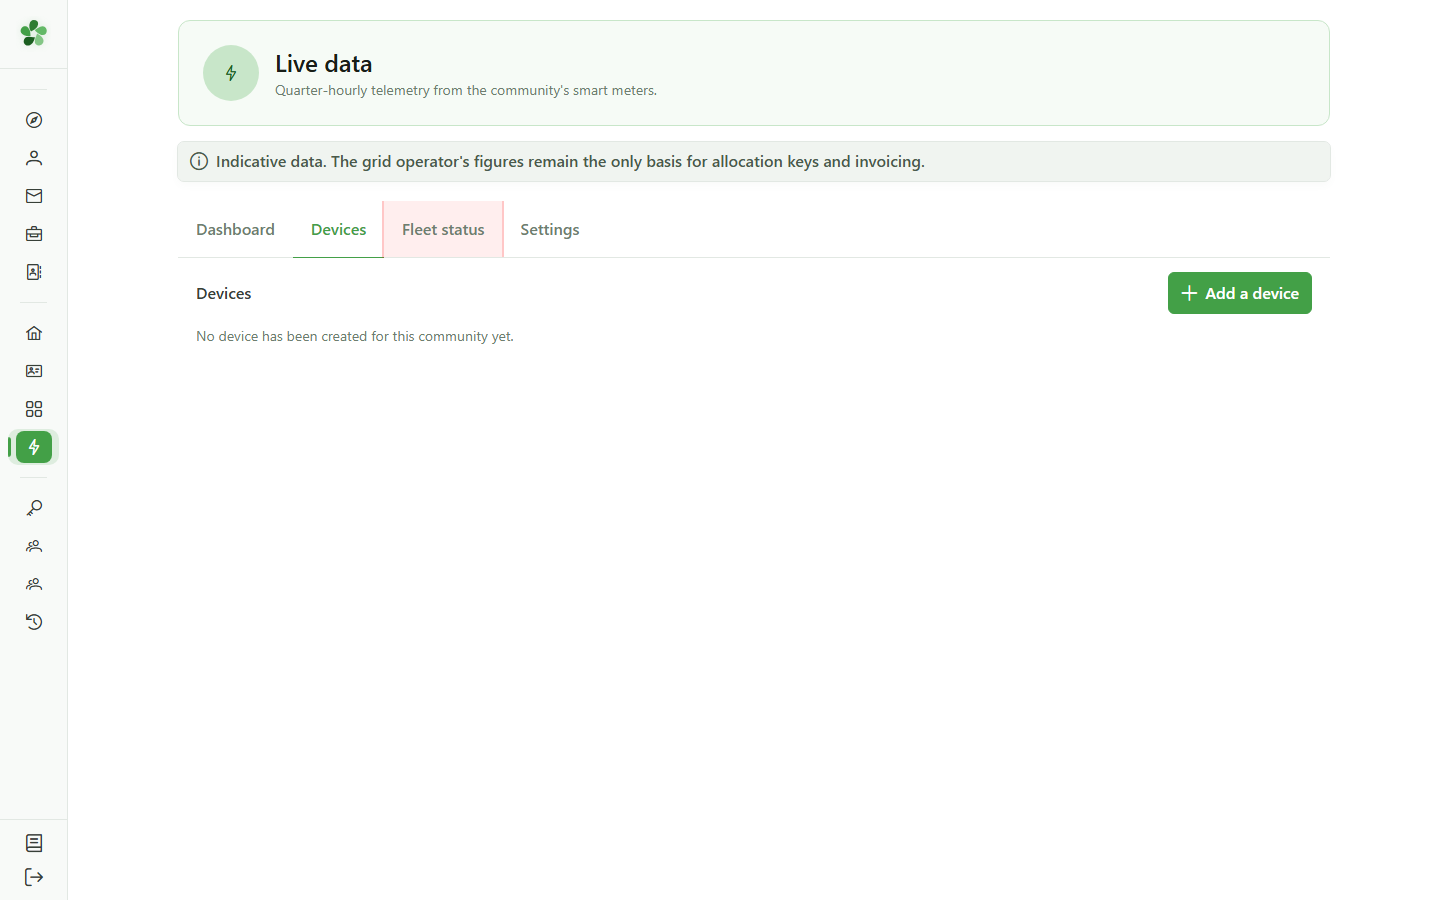
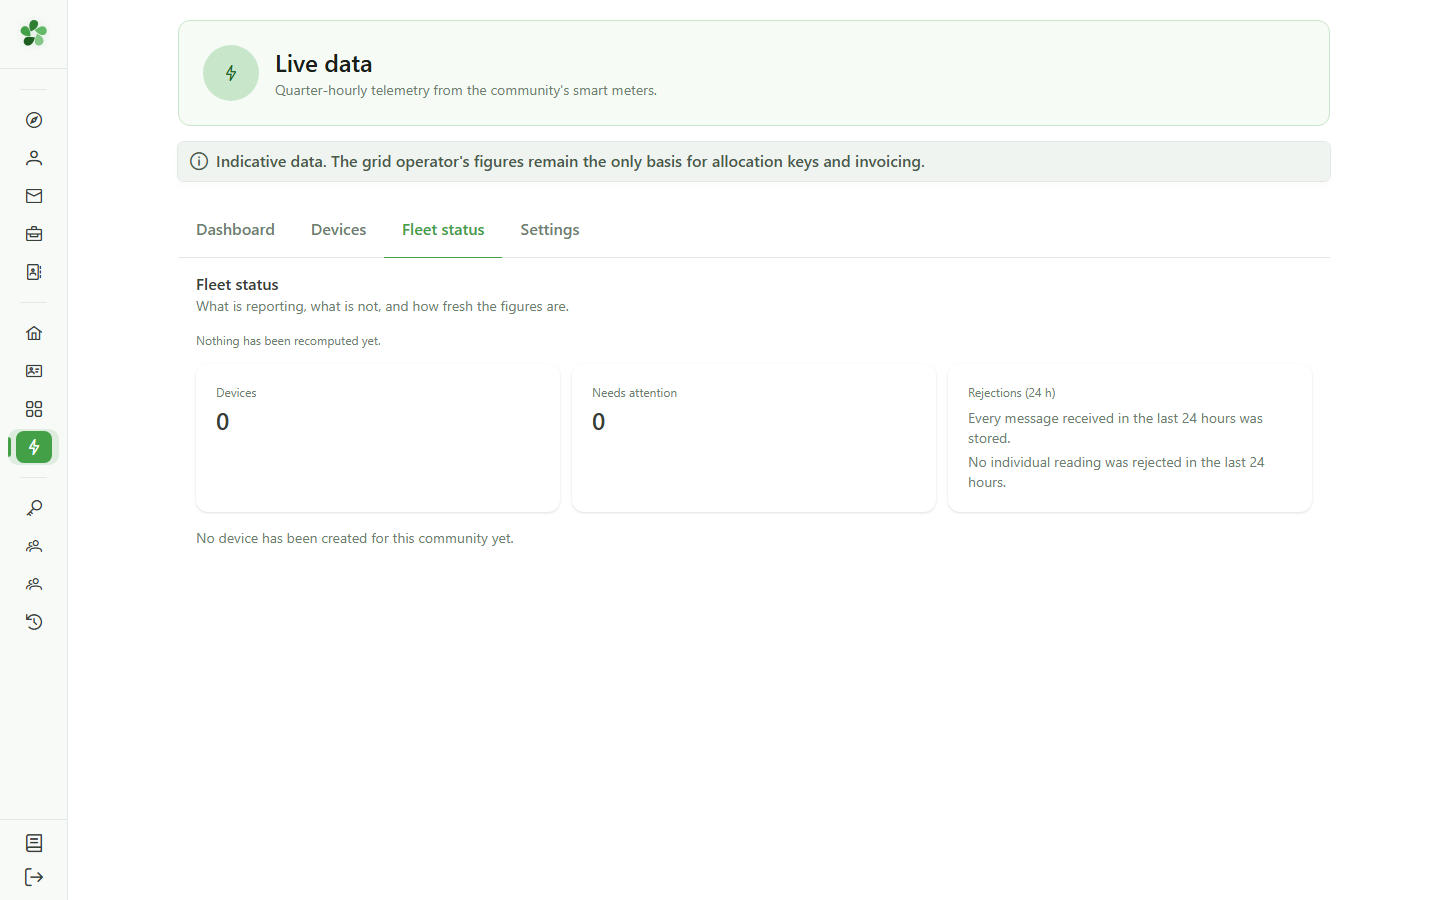
The "Fleet status" tab is the maintenance screen: it tells you whether the figures are up to date, which devices need attention and what could not be stored.
8 An empty fleet
Fleet status
With no device, nothing has been computed yet and no device needs attention. As soon as a device reports, this screen shows how long ago the figures were recomputed and flags devices that are silent, offline or whose readings are rejected.
9 The visibility settings
Settings
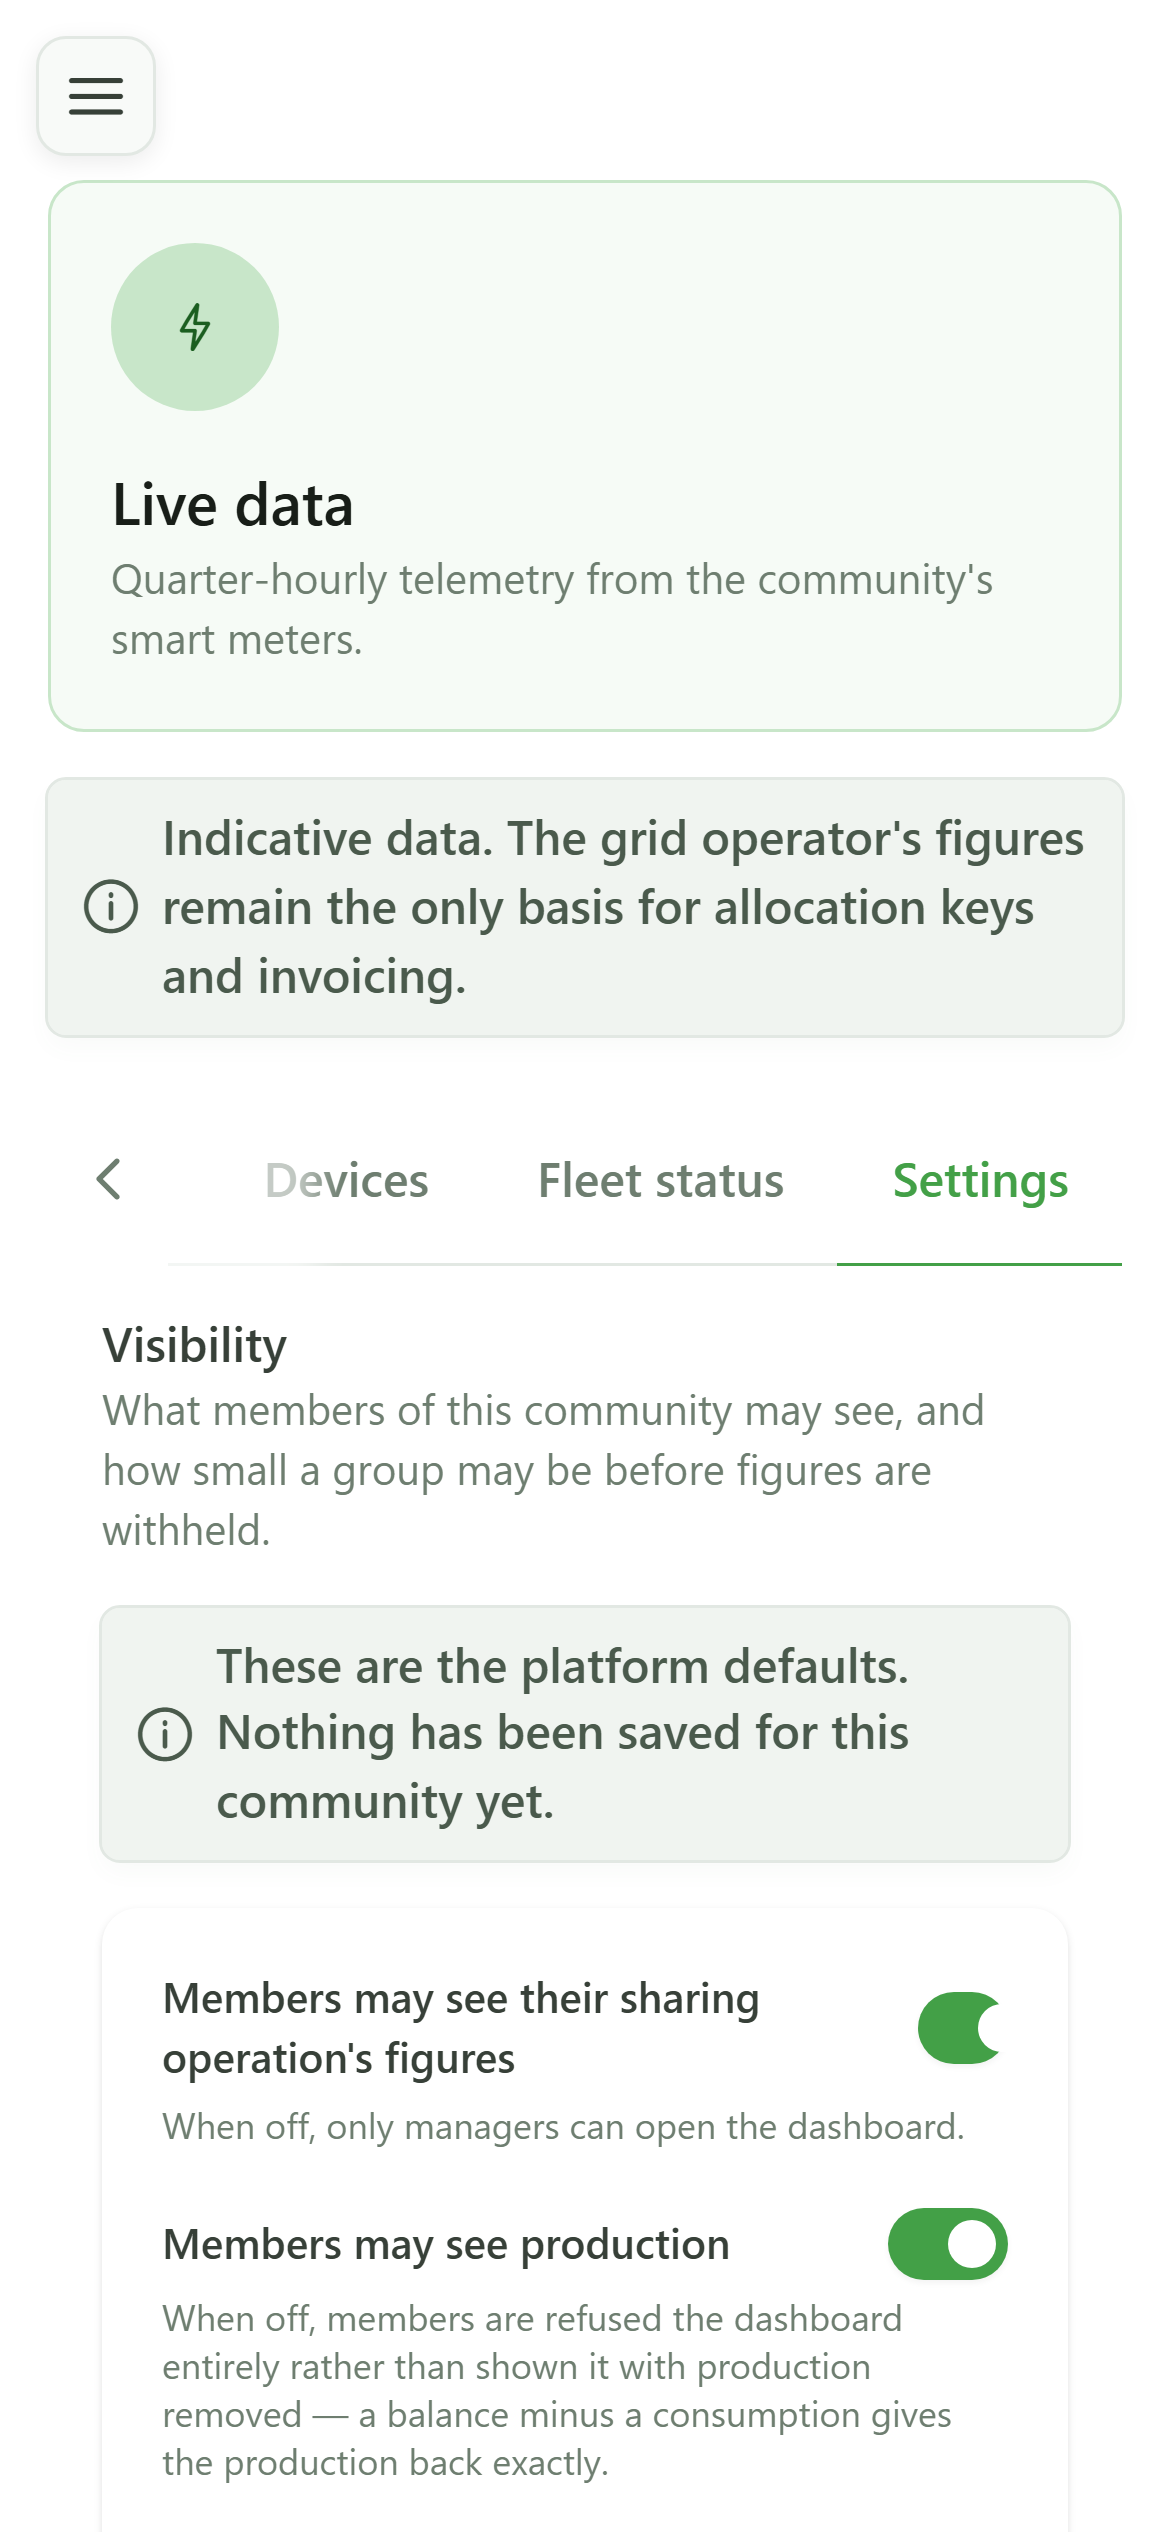
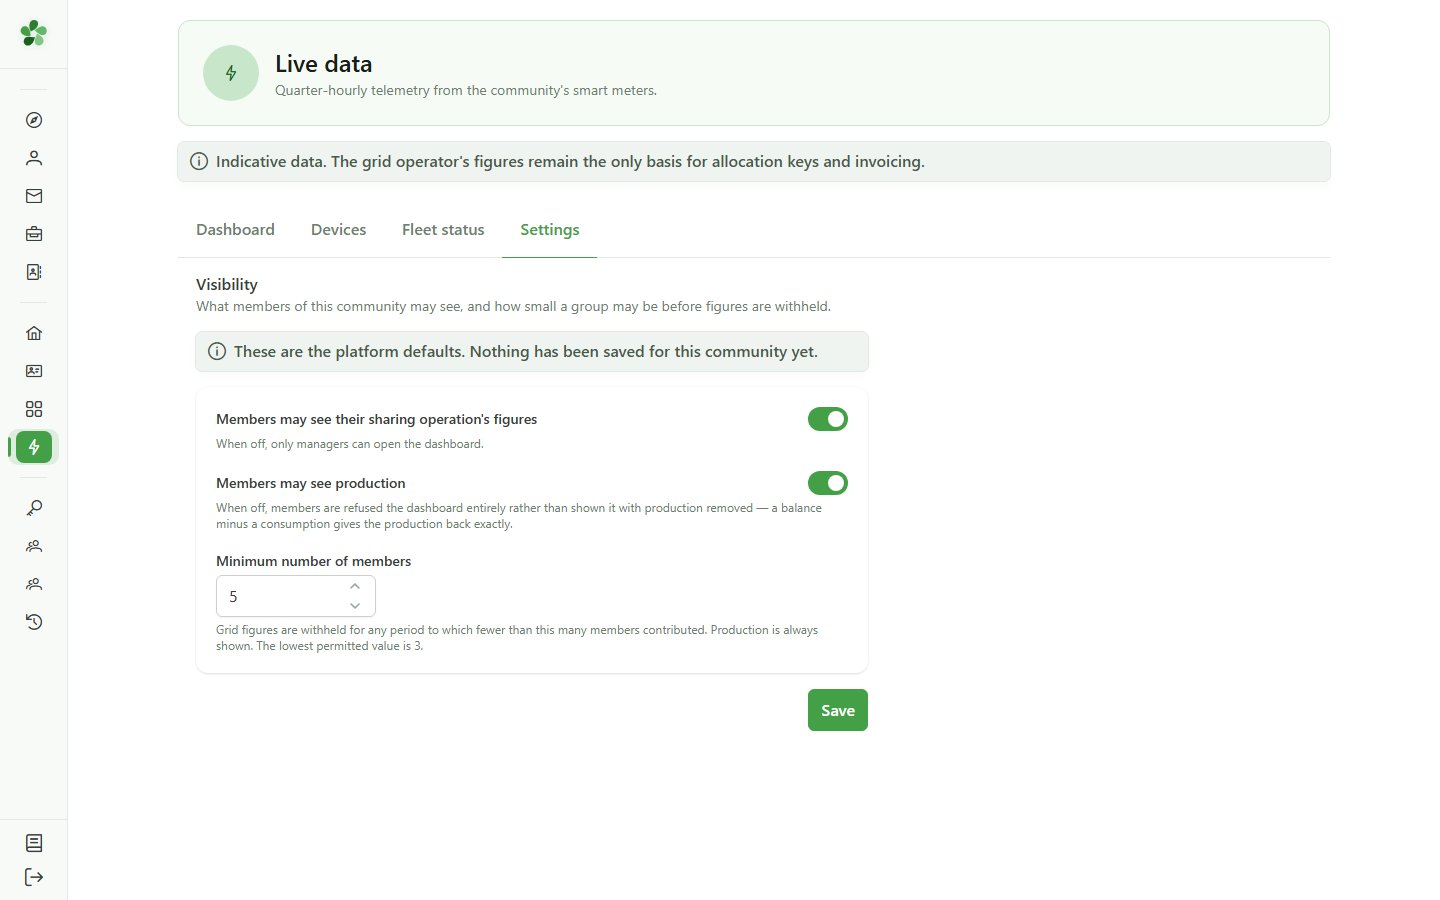
The settings decide what members will be able to see, and the minimum number of members below which grid exchanges stay hidden so that no household can be identified. Until they are saved, the platform defaults apply.
Discover Live data
Guide utilisateur
User guide
Gebruikershandleiding
Benutzerhandbuch
1 Open Live data
Navigation
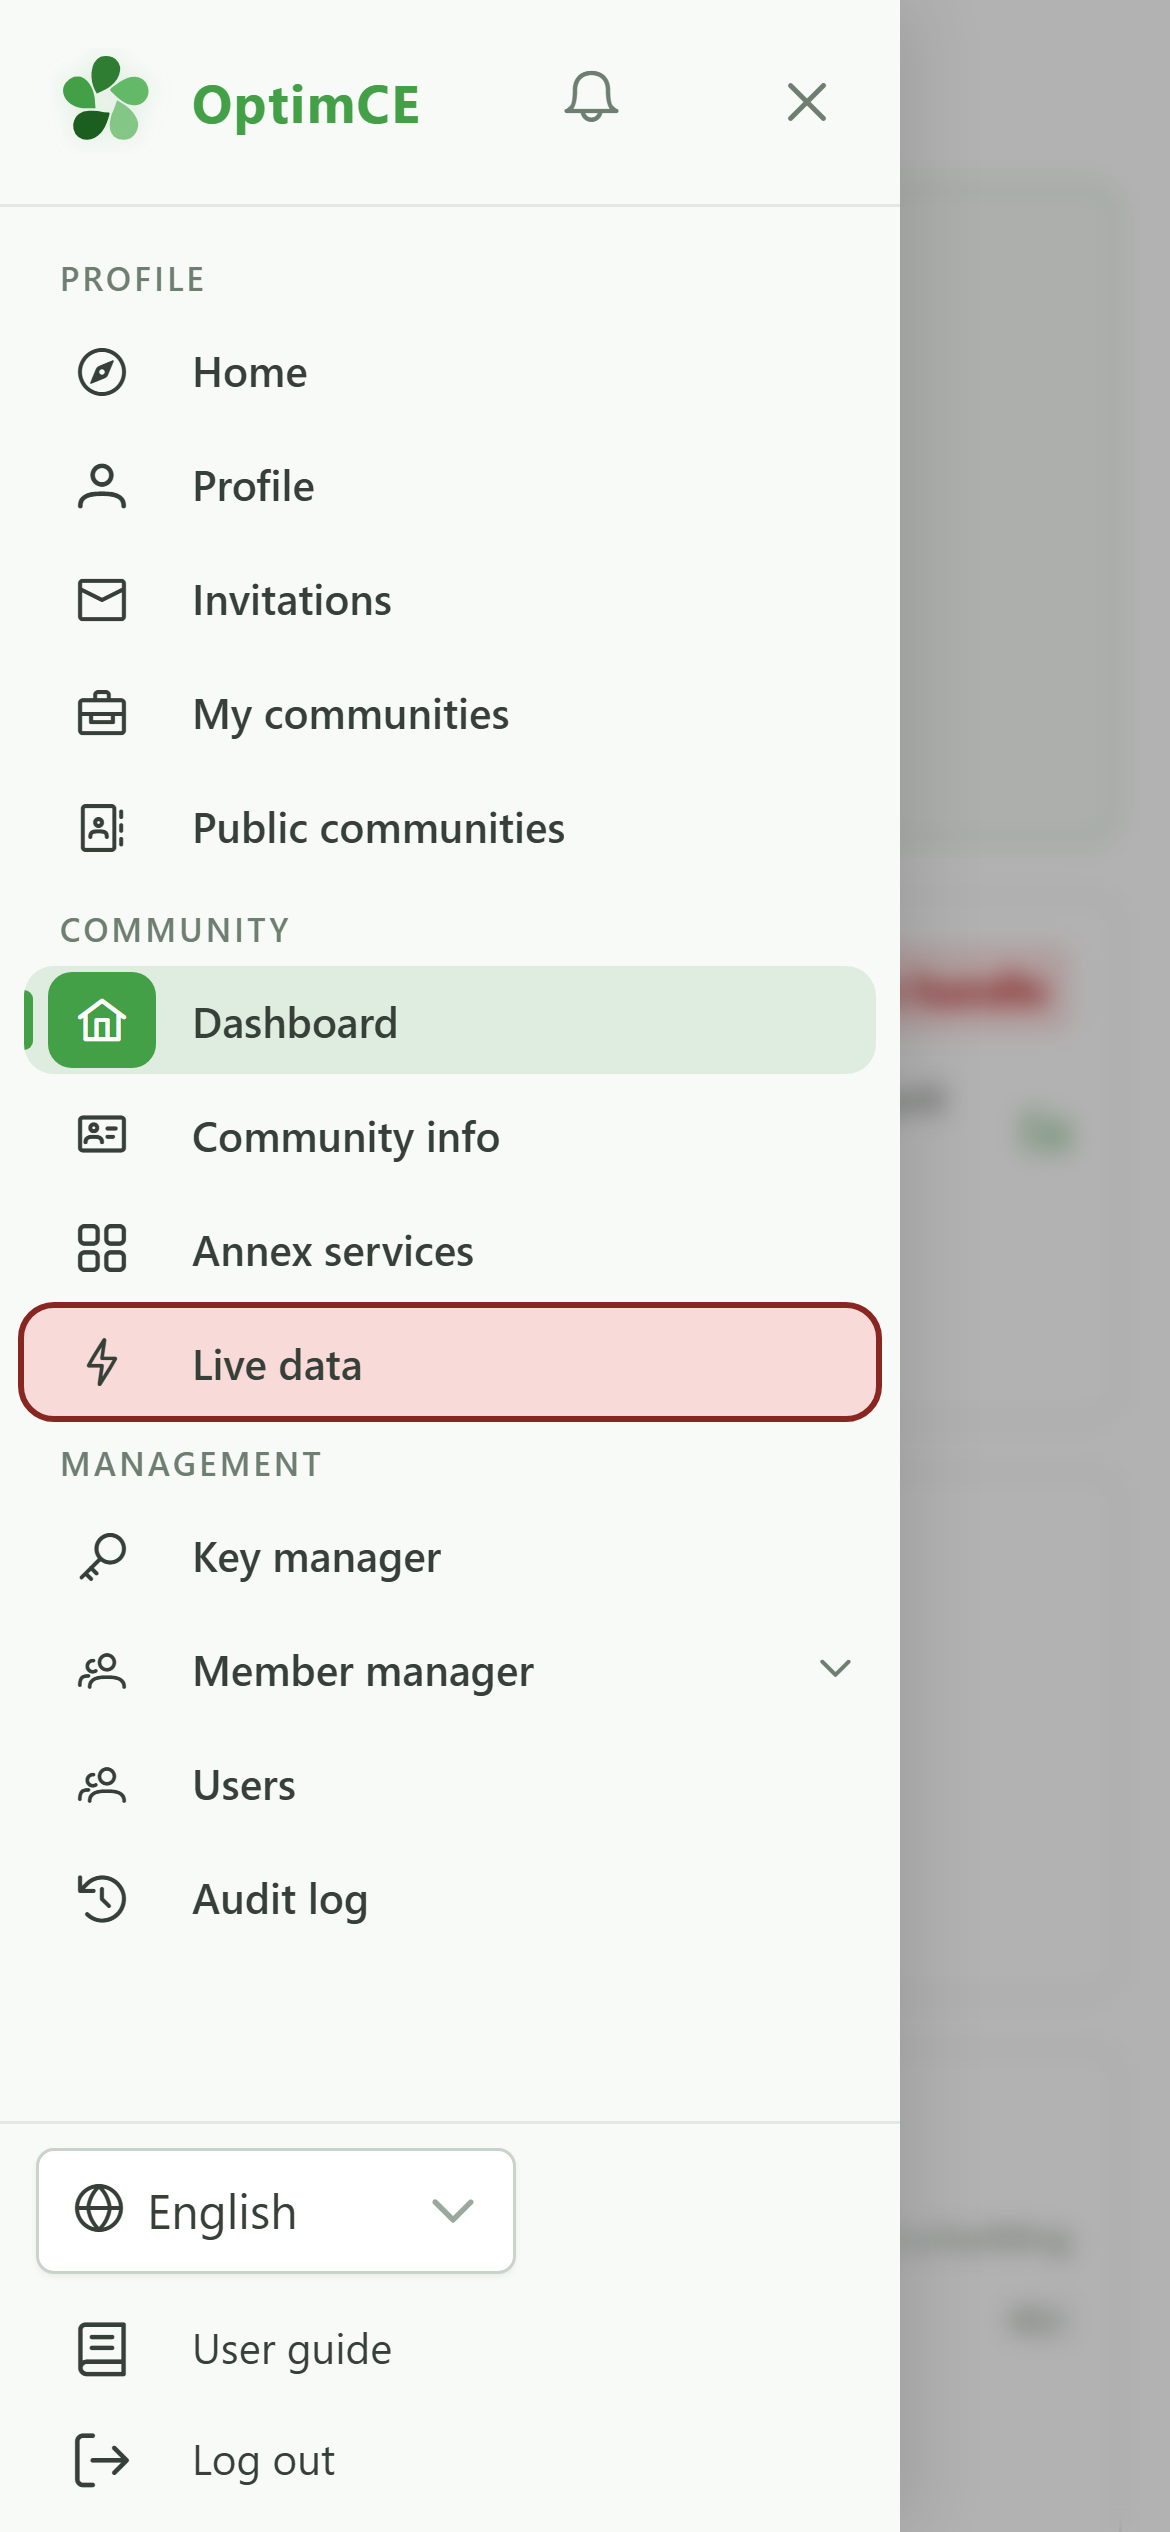
Tap the menu icon to open the drawer, then "Live data". The link only appears for the managers of a community subscribed to the module.
2 The Live data console
Live data
This console follows, quarter-hour by quarter-hour, what the devices installed at members' premises measure. The figures are indicative: only the grid operator's data is used for allocation keys and invoicing.
3 The dashboard
Dashboard
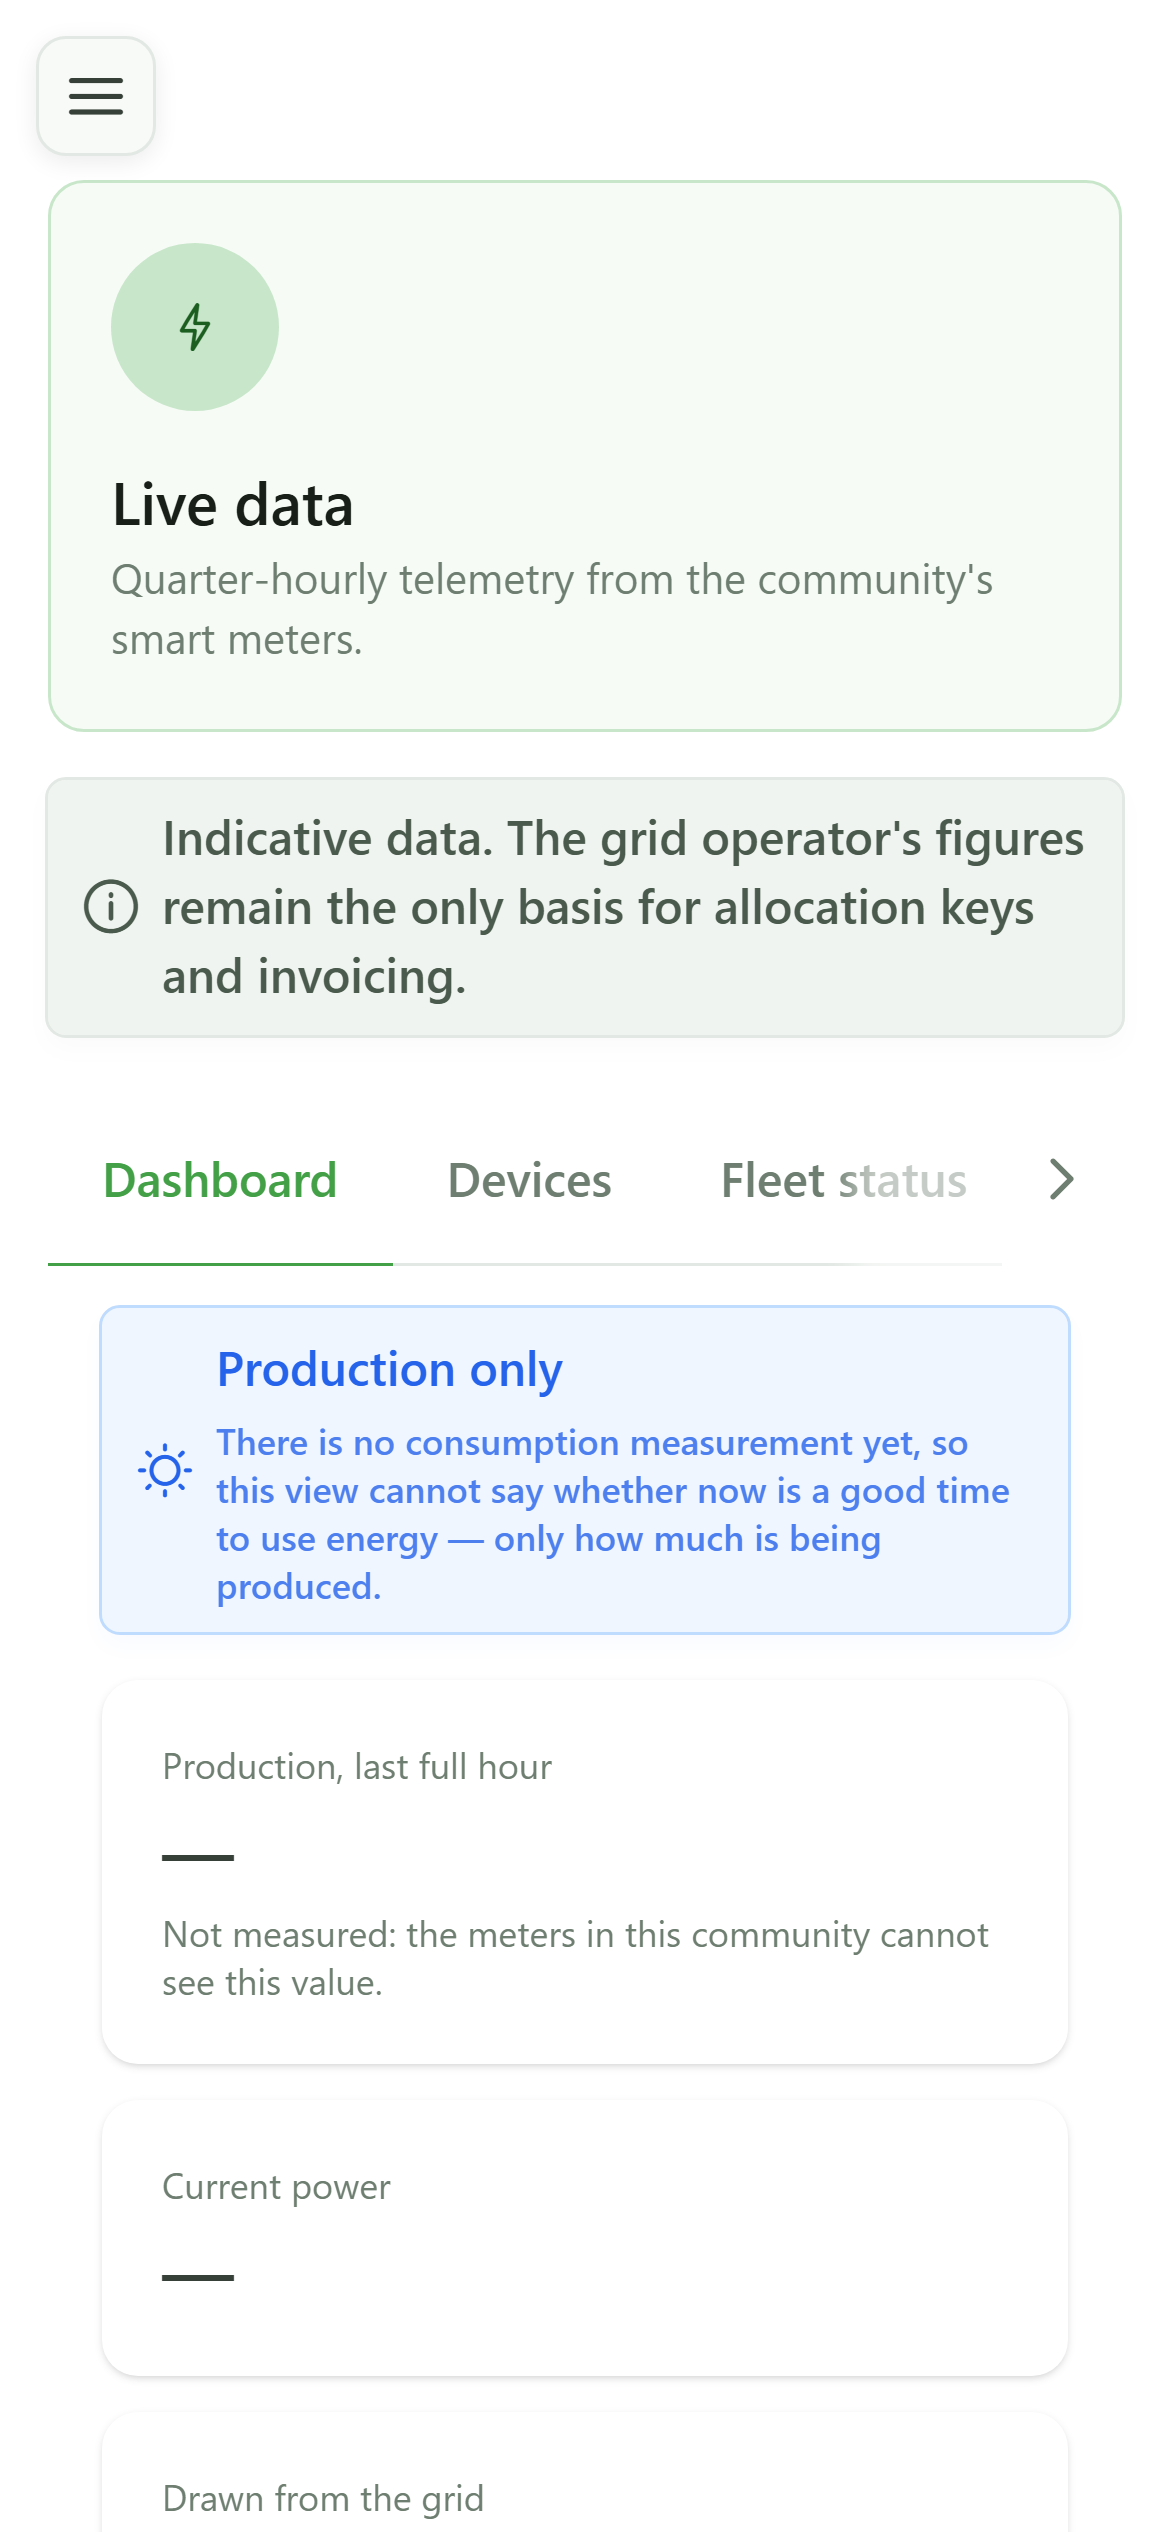
The dashboard sums up the last full hour: production, power, grid exchanges and the state of the fleet. Until a device has sent a reading, every card shows a dash rather than a zero — "not measured yet" is not "nothing produced".
4 Choose the chart period
Dashboard
The charts — production and export, then consumption drawn from the grid — cover 24 hours (per quarter-hour), 7 days (per hour) or 30 days (per day). While nothing has been measured, they say so instead of drawing a flat line at zero.
5 The devices
Devices
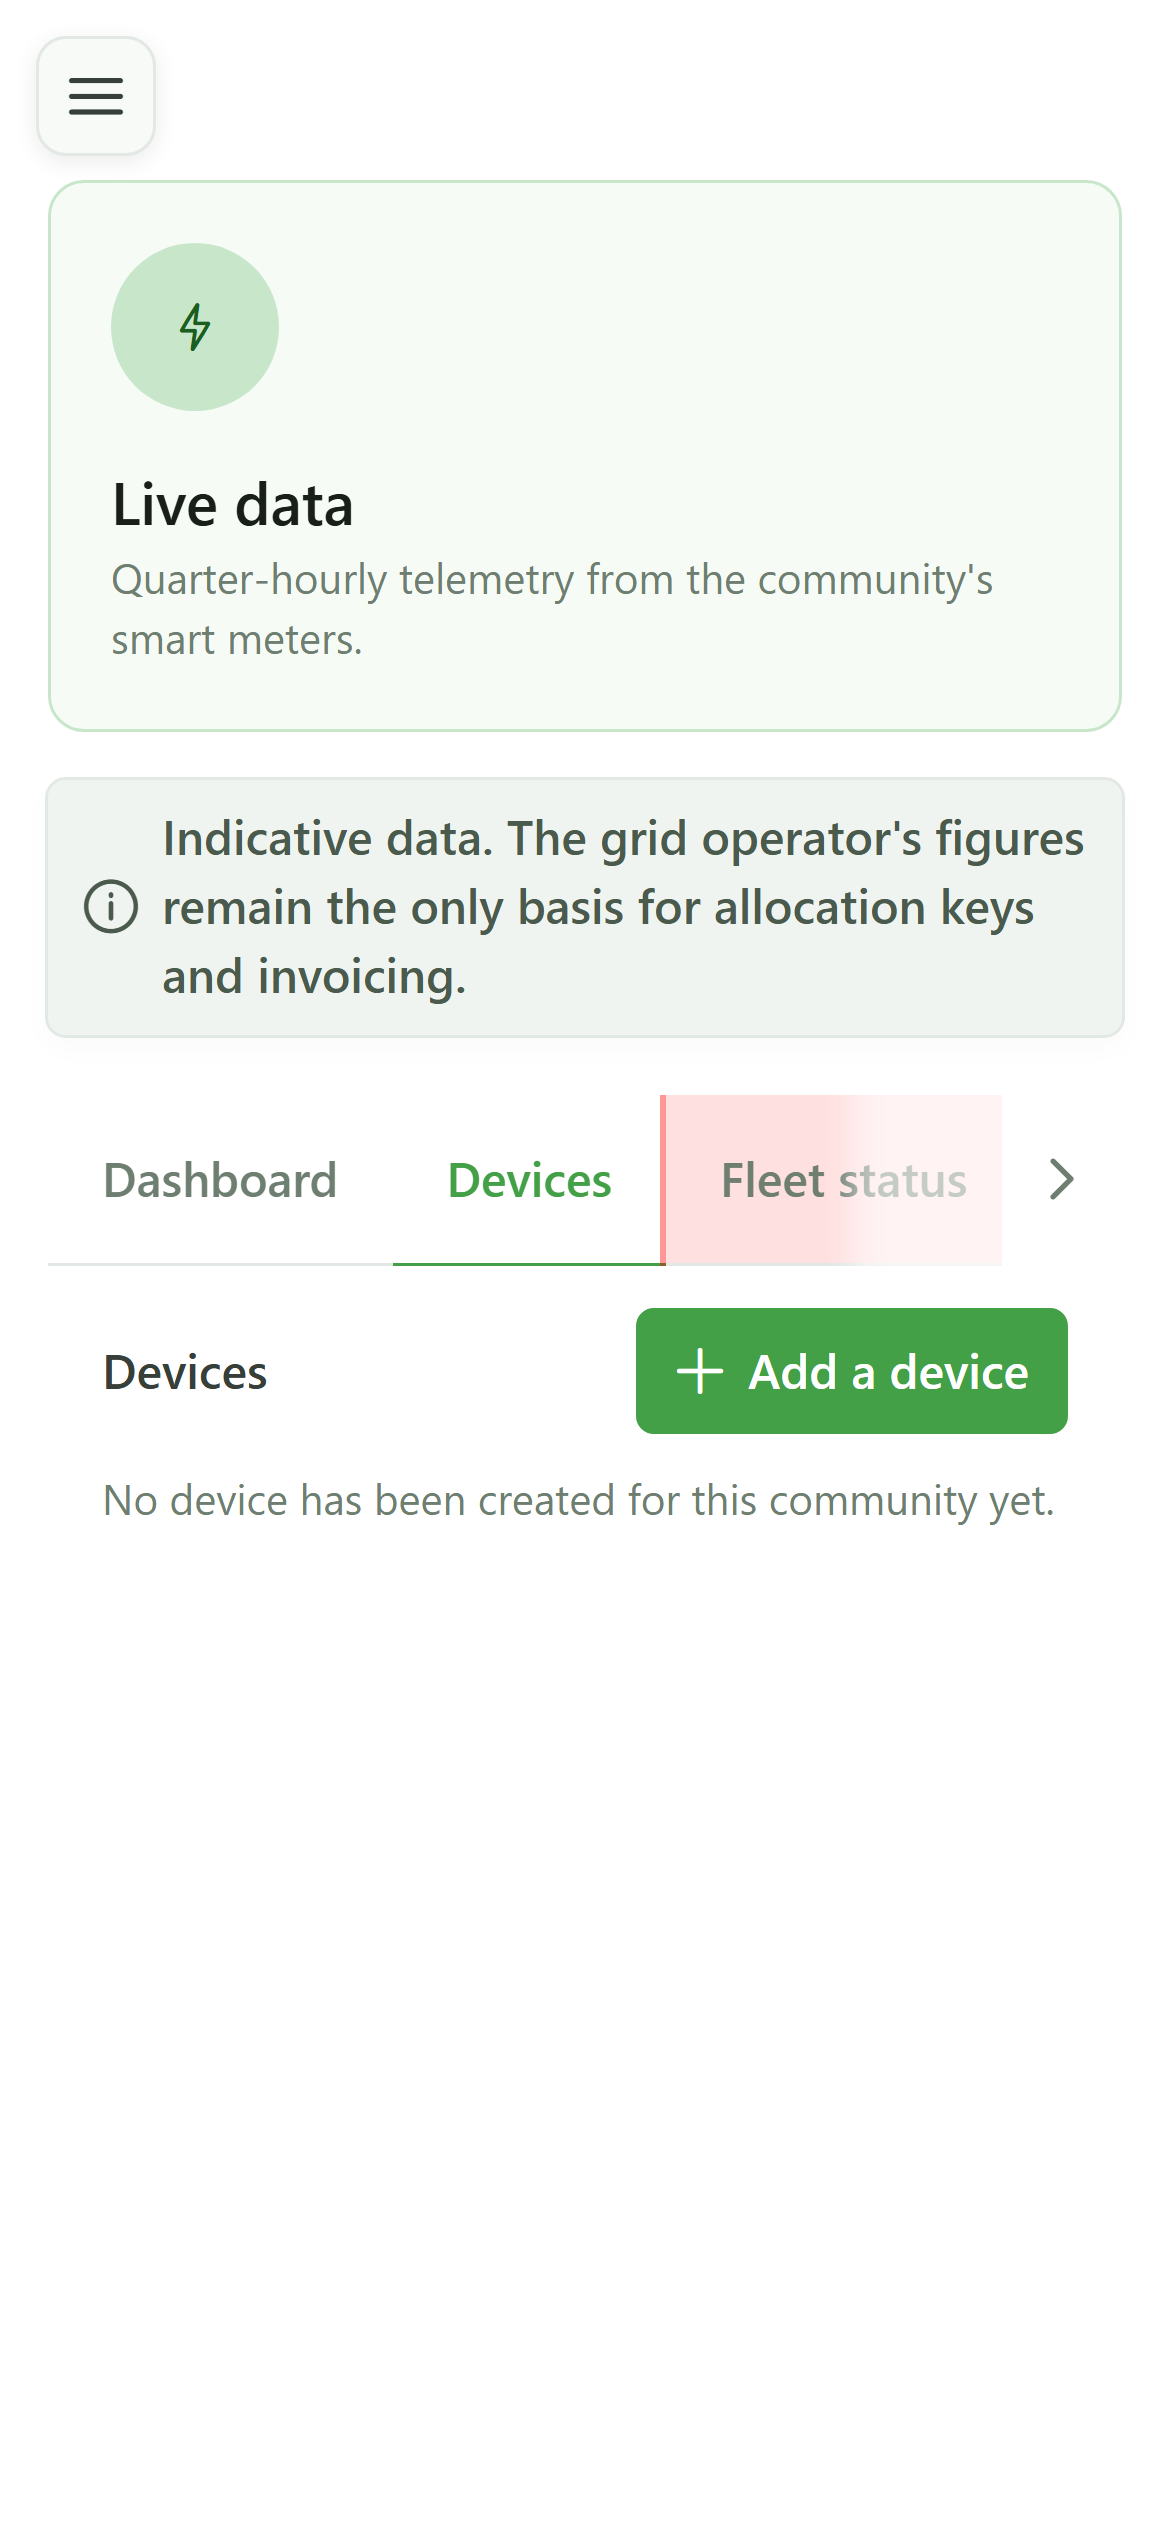
The "Devices" tab lists the boxes connected to the members' meters, with their reporting state.
6 No device yet
Devices
The community has no device yet. The "Add a device" button creates a device for a meter and issues its enrolment code — see the "Connect a device" guide.
7 The fleet status
Fleet status
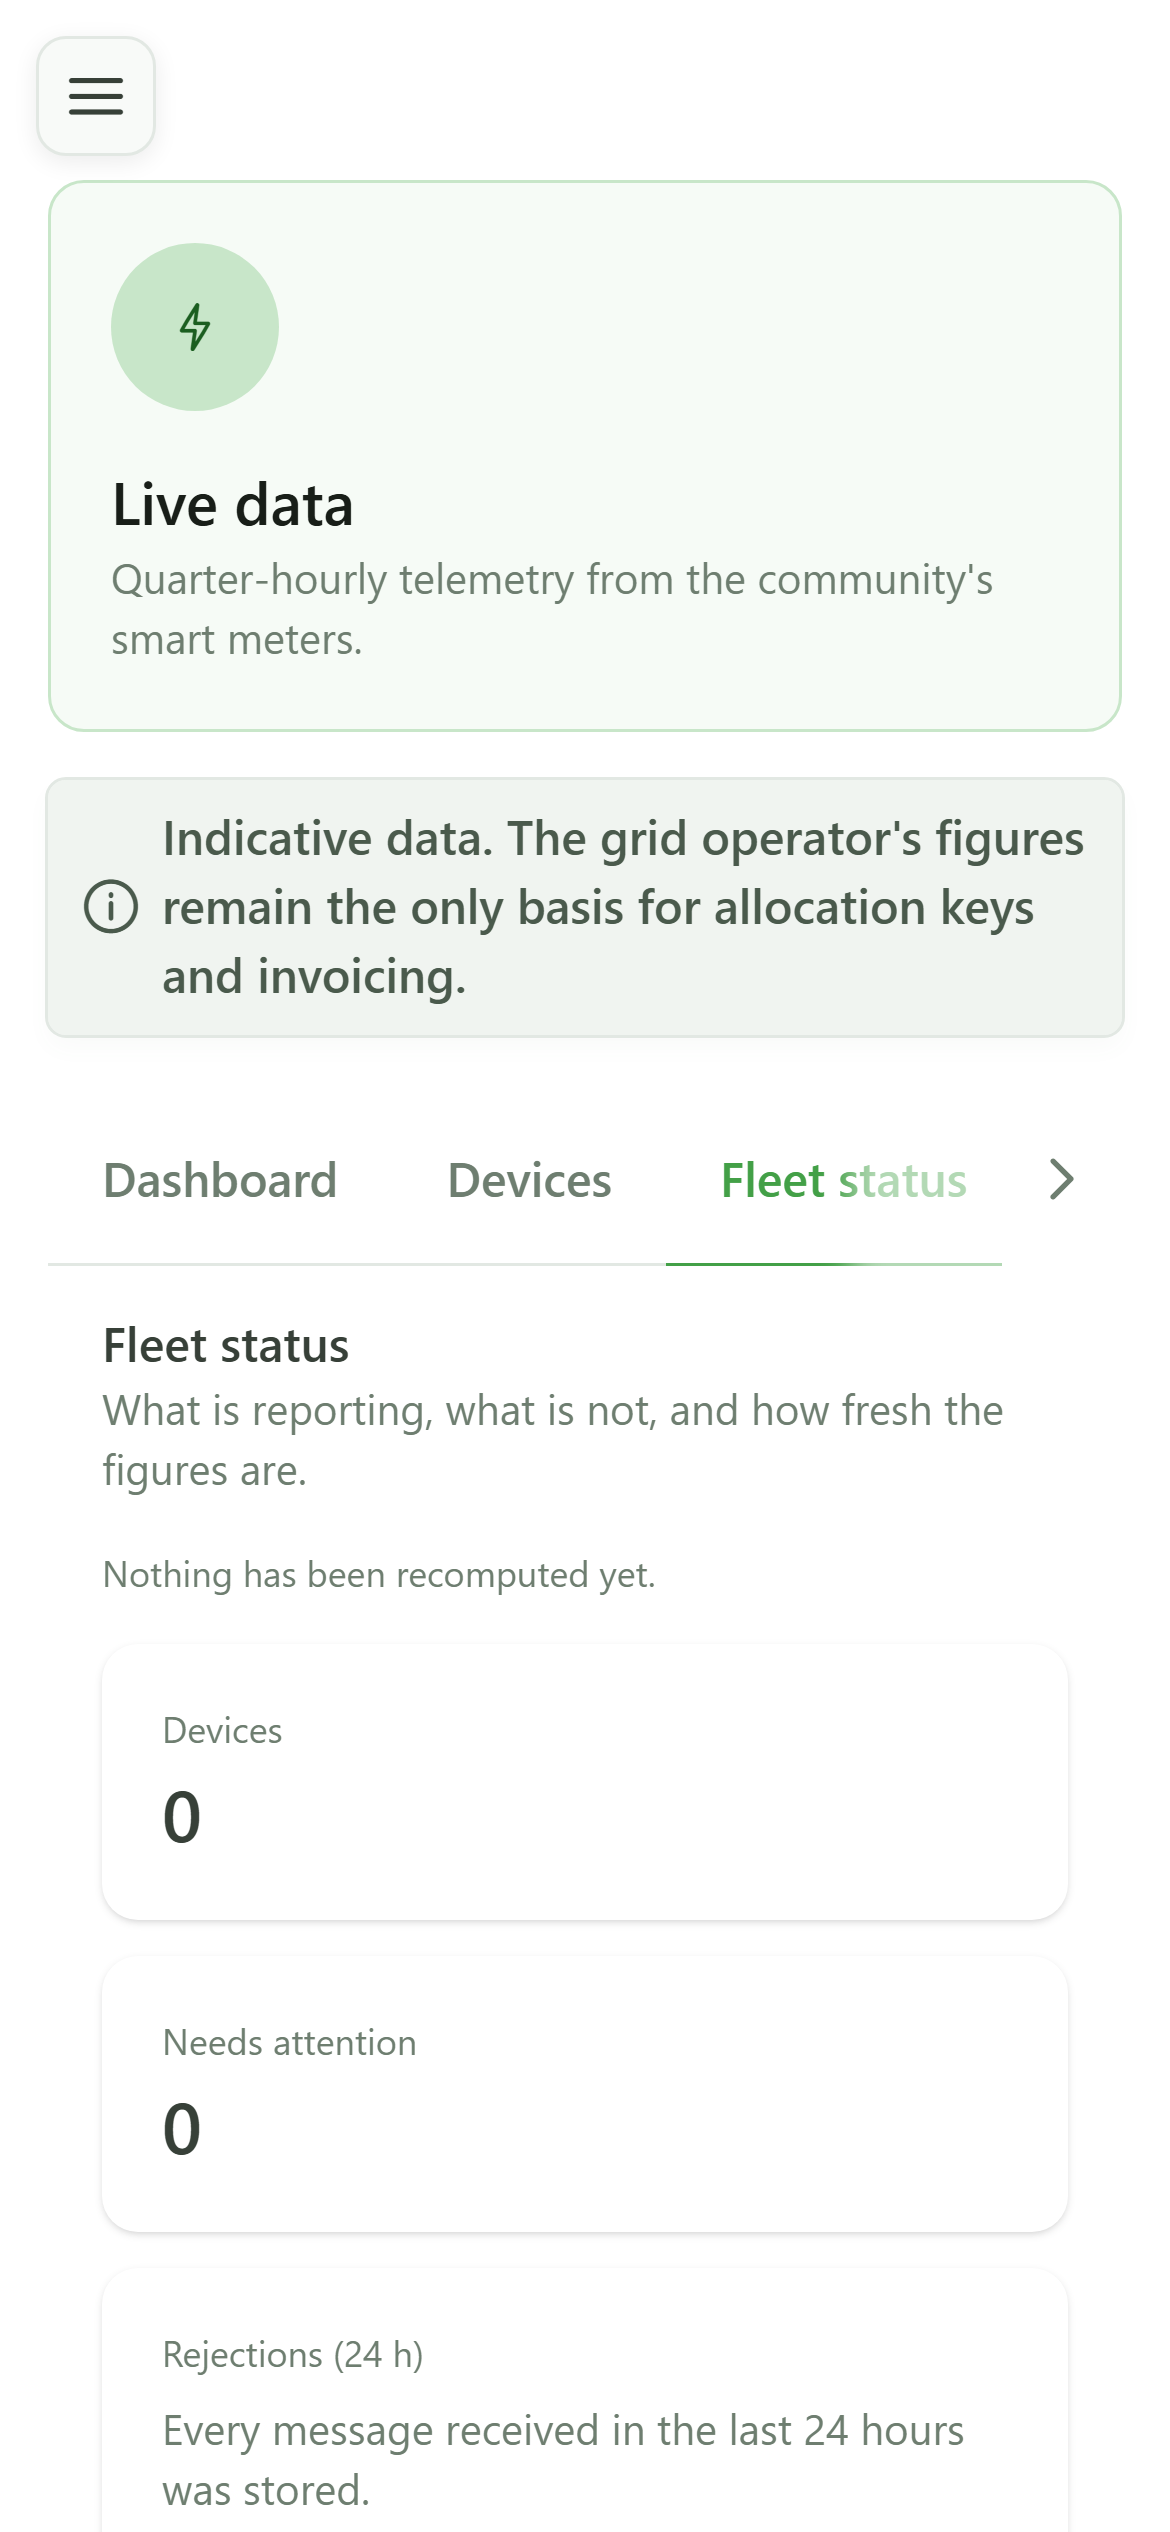
The "Fleet status" tab is the maintenance screen: it tells you whether the figures are up to date, which devices need attention and what could not be stored.
8 An empty fleet
Fleet status
With no device, nothing has been computed yet and no device needs attention. As soon as a device reports, this screen shows how long ago the figures were recomputed and flags devices that are silent, offline or whose readings are rejected.
9 The visibility settings
Settings
The settings decide what members will be able to see, and the minimum number of members below which grid exchanges stay hidden so that no household can be identified. Until they are saved, the platform defaults apply.